 Saad Ullah

⬤ Meta Platforms (META) is trading in a narrow range just below key resistance, sitting near $669 after bouncing back from November lows. The daily chart shows price action compressing into a sideways pattern, and technical analysis suggests the stock could be gearing up for a move higher—potentially around 12.3% from current levels.
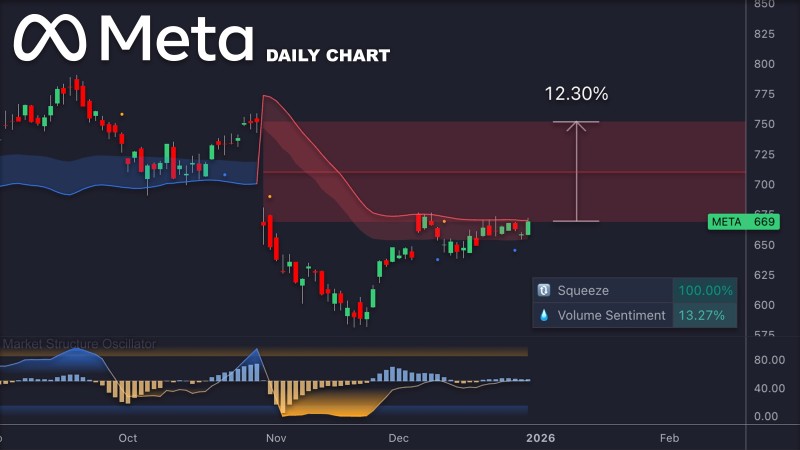
⬤ The technical picture shows some interesting dynamics. There's a 100% "Squeeze" reading combined with volume sentiment at just 13.27%, which basically means the stock is coiled up tight while trading activity stays pretty quiet. META has been stuck in this range for several sessions now, hovering in the mid-$660s without much volatility as it finds its footing.
⬤ Looking at momentum indicators, the Market Structure Oscillator has shifted from deeply negative territory earlier in the quarter to a more neutral zone, matching how META's downside pressure has eased since early December. The stock is still trading under that upper resistance boundary, so the big question now is whether it breaks out toward that 12.3% target or slips back down into the lower end of the range.
⬤ This kind of tight consolidation after a recovery phase often sets up bigger moves once the breakout finally happens. With META holding steady around $669 and clear resistance zones mapped out above, how this consolidation resolves could signal where broader sentiment stands on Meta Platforms heading into 2026.
 Saad Ullah


