 Saad Ullah

⬤ XRP is showing textbook technical structure on the daily chart—starting with a sharp rally, then cooling off into a long sideways phase, and finally drifting lower in a controlled downtrend. Right now it's trading close to the $1.86–$1.88 zone, which has acted as a key floor before. The price is starting to squeeze into a tighter range around this support level, and market watchers are asking whether this compression signals the end of the latest drop.
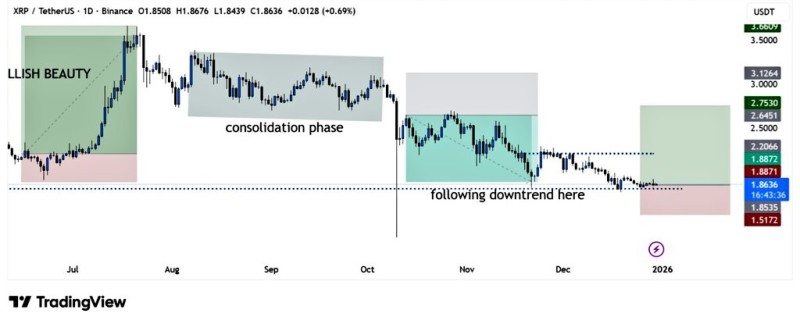
⬤ The initial move was explosive—XRP shot higher into July before settling into a wide consolidation band through August and September. After that sideways action, the trend turned bearish with a series of lower highs inside defined resistance zones. That steady grind lower has now brought XRP back down to the same support area that held earlier in the cycle.
⬤ What's happening now is a narrowing price range around $1.86, which usually means volatility is drying up and the market is catching its breath. Nearby resistance sits between $2.0 and $2.6, while deeper support extends down to around $1.5. That gives XRP a clear technical framework to work within.
⬤ This matters because support zones that get tested repeatedly after long downtrends often become decision points. With XRP now sitting at the lower edge of its multi-month range and showing compression, the next breakout—whichever way it goes—could set the tone heading into 2026. Traders are watching closely to see if this consolidation near support turns into a floor or if the broader downtrend still has room to run.
 Saad Ullah


