 Saad Ullah

⬤ Oracle is catching eyes as it trades around $195 with momentum signals starting to flip. The stock looks heavily oversold on the charts, and several key indicators are beginning to point upward after weeks of pressure. The main target being watched is the 200-day moving average sitting near $214, which could act as the next natural stopping point if this bounce continues.
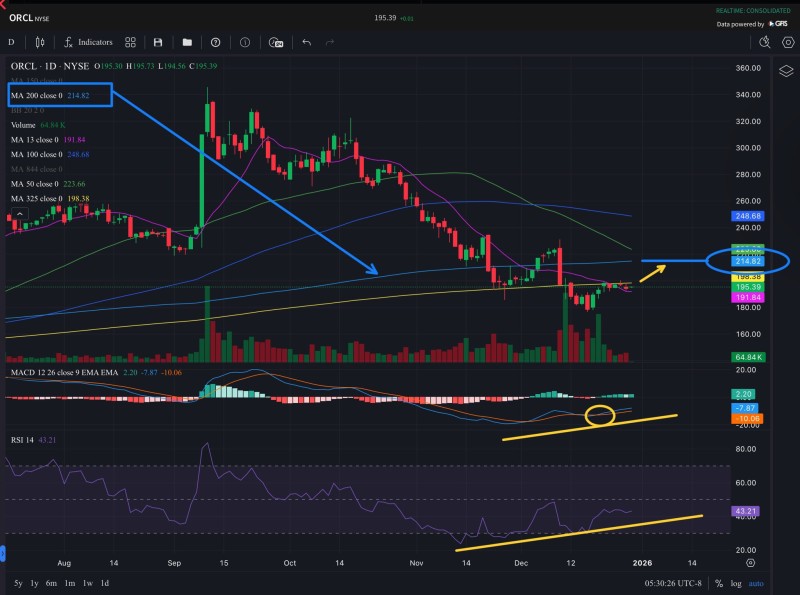
⬤ The setup revolves around MACD and RSI showing real improvement. MACD just printed a bullish crossover on the daily chart, with both the MACD line and signal line climbing toward the zero mark. RSI is trending up too, approaching previous turning points that suggest the stock is regaining some relative strength. Price also pushed back above the 13-day EMA (shown in purple), which adds another layer of confidence to the developing pattern.
⬤ The so-called "Banana325SMA" is another piece of the puzzle. ORCL briefly slipped below this 325-period moving average before climbing back above it, and holding above this line suggests the price is treating it as support. One trade idea floating around involves January 30 $205 calls priced around $6, with the upside play targeting that $214 zone and a mental stop placed below $190.
⬤ With oversold conditions easing, a fresh MACD cross, rising RSI, and key moving averages being reclaimed, Oracle is setting up for what could be a technical bounce. The $214 level stands out as the logical target if momentum keeps building. ORCL is still trading below its major long-term averages, but early signs of stabilization are starting to appear, and how the stock behaves around these technical marks will likely shape the next few sessions.
 Saad Ullah


