Saad Ullah

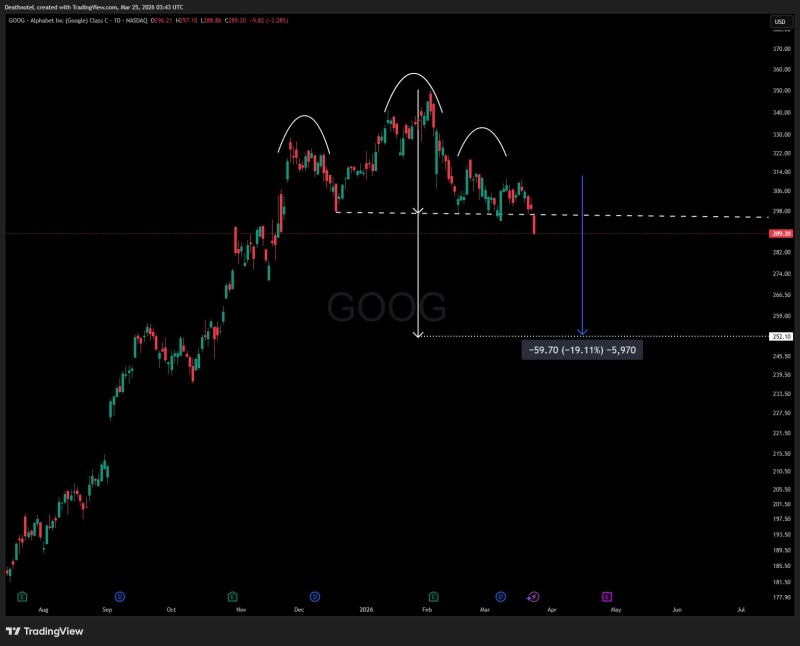
Alphabet has entered technically dangerous territory. After weeks of building a textbook head and shoulders pattern, price finally cracked below the $295-$300 neckline zone, trading around $289, signaling a structural shift that bears watching across large-cap tech. The setup carries a measured-move target toward $250, roughly 19% below the neckline.
Classic Formation, Clear Breakdown: What the Chart Shows
The pattern developed over several weeks on the daily chart, featuring three distinct peaks with the middle peak (head) sitting notably higher than the two shoulders. The neckline held near $295-$300, a level that had also drawn attention in Alphabet Finds Support at $302 as Trend Hangs in Balance, where lower highs were already flagging a weakening price structure. Once that floor gave way, the pattern transitioned from formation to confirmed breakdown.
$250 Target in Focus as 19% Downside Opens Up
The measured move technique - subtracting the pattern height from the neckline - points to a downside target near $250. This projection aligns with earlier analysis in GOOG Stock Analysis: Alphabet Faces Key $316 Breakout Level, which warned that losing the $300 zone could accelerate selling pressure. For broader context on how these formations behave, Google and Nvidia Defy Bearish Chart Patterns outlines how head and shoulders setups typically act as reversal signals unless strong momentum steps in to invalidate them.
The broader significance here goes beyond GOOG alone. When a stock of Alphabet's size loses a major support zone, it can drag on index-level performance and shift sentiment across the tech sector. With $300 now acting as overhead resistance rather than support, bulls would need to reclaim that level convincingly to neutralize the bearish technical picture. Until then, the path of least resistance points lower.
 Saad Ullah