 Marina Lyubimova
⬤ Alphabet Inc. (GOOG) is holding its ground near the $315 mark, with daily charts showing solid upward momentum that's been building since mid-year. The stock is sitting comfortably above its 200-day moving average, which tells you the longer-term trend is still pointing up. Technical readings show GOOG maintaining a clean pattern of higher highs and higher lows since late summer, with the stock staying above its short-term moving averages throughout the climb.
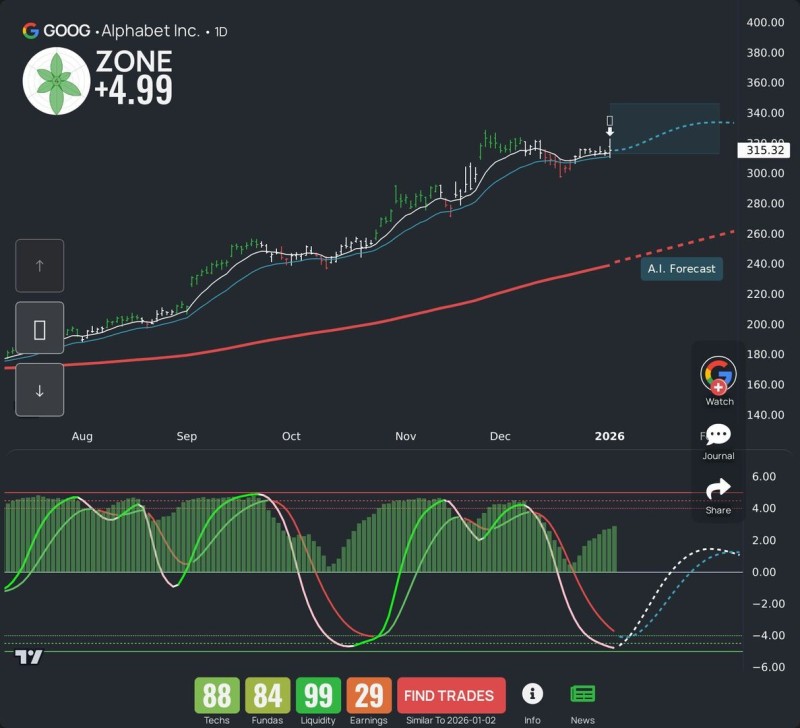
⬤ An AI-powered forecast layered onto the chart is painting an interesting picture for the weeks ahead. The projection zone extends higher, suggesting the current trajectory could push the stock into the mid-$330 territory if momentum holds. What's catching attention is how the momentum indicators in the lower panel recently bounced up from near-term lows, signaling fresh buying interest is coming back into the picture. The LEAF score backs this up with strong technical strength and high liquidity readings, creating a pretty favorable trading environment.
⬤ December brought some consolidation, but GOOG broke out again and hasn't looked back. The dotted projection line on the chart traces a gradual climb that could take the stock from its current $315 level up toward that $330 range. The AI trend line running below the price action shows a rising longer-term model that's lining up nicely with what's happening in the near term, which usually means the trend has legs.
⬤ Why this matters: GOOG is one of those mega-cap names that moves the needle for the entire tech sector and broader market sentiment. When you see technical indicators staying this strong on a stock this size, it reinforces what's been driving equity performance lately—large-cap tech strength. The AI outlook tools are giving a thumbs up to continued positive structure, which means GOOG's price behavior will likely keep serving as a bellwether for how investors are feeling about growth and technology stocks overall.
 Marina Lyubimova


