 Usman Salis
⬤ Alphabet's GOOG shares are trading close to the top of a consolidation pattern that's been building on the daily chart. According to @TrendSpider, the technical setup and options activity are telling the same story. The stock recently bounced back toward $315 after pulling back within a downward-sloping channel that formed after a strong rally earlier this year.
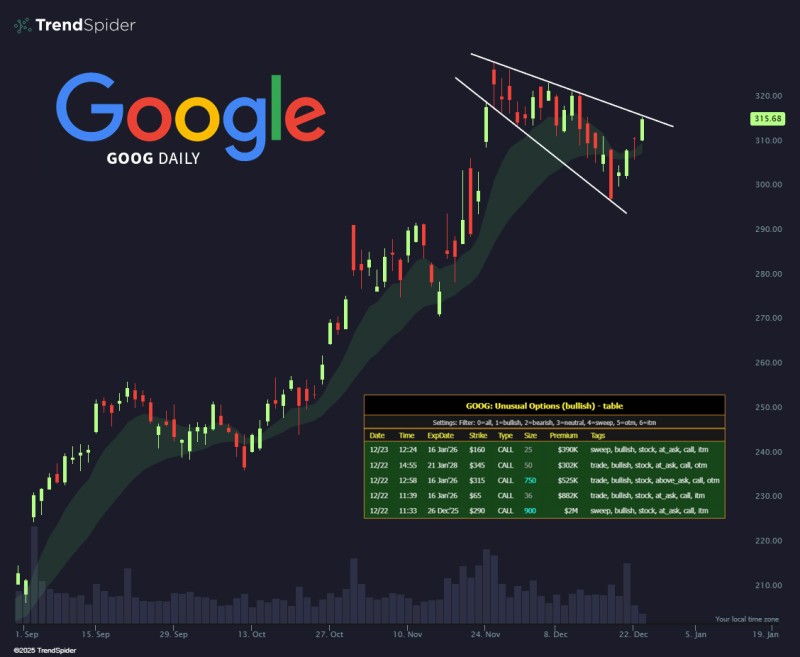
⬤ Looking at the chart, you can see GOOG has been in a broader uptrend since early in the year, followed by a controlled pullback that stayed within parallel channel lines. The price is still sitting above the rising trend and looks more like it's taking a breather than breaking down. This latest push higher brings GOOG back near the top of that channel—a spot traders usually watch closely to see if momentum kicks back in or if the stock needs more time.
⬤ The options flow backs up what the chart is showing. There's been unusual activity in bullish call trades, with strikes ranging from around $290 to $345. These aren't small bets either—large contract sizes are showing up across multiple expirations, including long-dated calls stretching into 2026 and beyond. The fact that these trades are hitting at or above the ask, with some hefty premiums, tells you there's real interest in upside exposure while the stock sits near recent highs.
⬤ This alignment matters because GOOG is a heavyweight in both the tech sector and major U.S. equity indices. When price structure and derivatives positioning line up like this, it usually means there's growing agreement on where things might head next. With GOOG holding above key trend levels and consolidating near the upper range, traders are watching to see if this setup breaks higher or just extends the sideways action in the coming sessions.
 Usman Salis


