 Usman Salis

AT&T stock is back at an important technical point after a long corrective stretch. The latest chart points to a bullish continuation setup rather than a fresh breakdown. As Elliottwave Forecast noted, the wave II correction appears complete, and the structure now favors a rally that could carry T above $29.79 if the support area remains intact.
The broader multi-year chart shows AT&T moving through a deep corrective phase before turning higher from its lows. That recovery leg has developed into a sequence of advancing waves on the right side of the chart, suggesting the stock is no longer in the same bearish pattern that dominated the earlier period.
The correction is labeled complete and focus now shifts to the next bullish phase, implying the larger trend may be transitioning from repair to continuation.
A Long AT&T Correction Gives Way to a Bullish Bias
What matters most here is not just the rebound itself, but the way price has held its recovery structure. The chart labels the larger correction as complete and shifts the focus to the next bullish phase - implying that the larger trend may now be transitioning from repair to continuation. Similar recovery-to-breakout structures have recently appeared across other stocks, including HIMS Stock Eyes $19.50 Breakout as Higher Low Formation Signals Potential Recovery, where holding key support levels defined the next expansion phase.
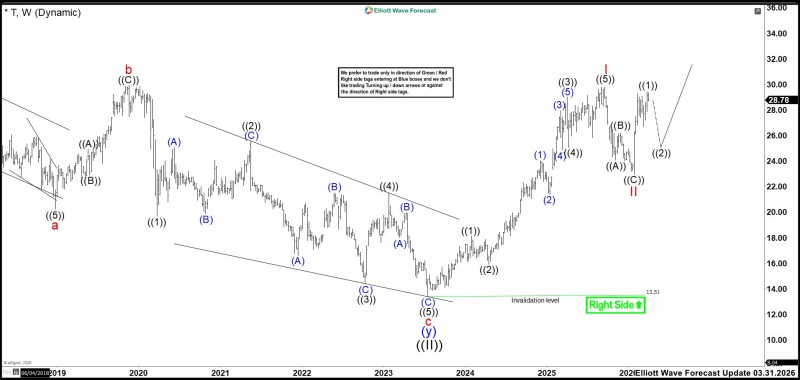
Why the AT&T Support Area Near $13.51 Matters So Much
This setup is explicitly conditional. The bullish view remains valid only while the marked support area holds, with the chart showing an invalidation level near $13.51. That level acts as the line separating a still-valid upward structure from a failed bullish count.
As long as T remains above the support zone, the preferred direction stays higher - the dominant bias favors upside continuation rather than renewed weakness.
In practical terms, the support zone is the foundation of the entire setup. That keeps the stock on what Elliottwave Forecast labels the "Right Side" - meaning the dominant bias favors upside continuation rather than renewed weakness. Related breakout setups have also been tracked in IREN Stock Compression Builds Toward $70 and $111 Breakout Targets, where the same principle of defined support levels driving directional bias applies.
The Push Above $29.79 Is the Real Test for AT&T Stock
The next important objective is a break above $29.79 - the threshold for the next rally phase. AT&T has already recovered sharply from its lows and is trading near the upper part of its recent range, so the bullish case now depends less on whether the stock can bounce and more on whether it can clear prior resistance.
A move through $29.79 would strengthen the idea that the correction is fully behind it and that a fresh upside leg is underway. Until then, the setup remains constructive but not yet fully confirmed. A similar structure unfolded in ASTS Stock Holds $71 Fibonacci Support, Eyes $129 Upside Target, where a defined support floor set the stage for a projected upside extension.
 Usman Salis


