 Marina Lyubimova

⬤ Amazon is currently trading around $238 after pulling back from recent highs, but the stock is holding firm above its 200-day moving average—a key support level that's kept the uptrend intact. The daily chart shows AMZN maintaining a technically healthy structure, with the price staying well above long-term trendlines that have served as reliable bounce points throughout the recent rally.
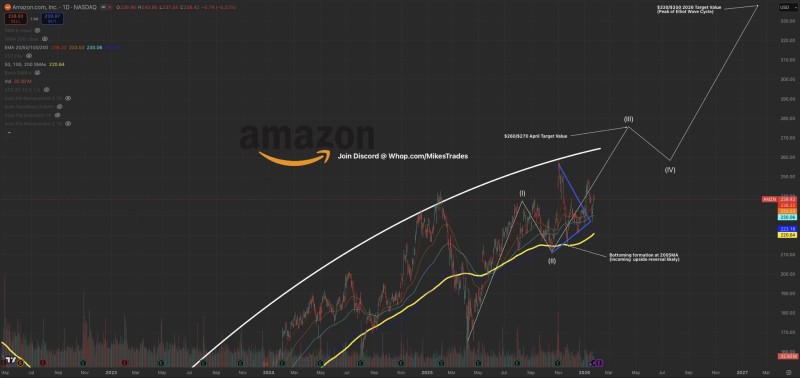
⬤ The chart reveals a longer-term bullish pattern built on rising moving averages and a clear bottoming formation near the 200-day line. After establishing that base, the stock pushed higher before entering its current consolidation phase. The technical setup suggests the next leg up could target the $260-$270 resistance zone, with extended projections pointing toward the $330-$350 range by 2026 based on Elliott Wave analysis.
⬤ Beyond the charts, Amazon's fundamentals are backing up the technical picture. The company just posted earnings per share growth of over 36% year-over-year, with revenue climbing about 13% and profit margins expanding significantly. Adding to the buzz, recent options activity has caught traders' attention—including a notable $500,000 call option purchase that's putting additional focus on the stock's near-term direction.
⬤ This analysis matters because it shows one of tech's biggest players combining solid technical support with strong fundamental momentum. As long as Amazon holds above its key support levels, the broader uptrend stays alive. The clearly marked resistance zones and projection targets give traders concrete reference points to watch as the stock works through this consolidation phase—and how it handles these levels could set the tone for other large-cap growth stocks across the market.
 Marina Lyubimova


