 Usman Salis

AMD stock is approaching a decisive technical threshold, with price structure now centered around a key support level that could determine the next move. More Crypto Online noted that the probability wave (4) is complete has increased - but only if price continues to hold above $203.92.
The probability that wave (4) is complete has increased - but only if price continues to hold above $203.92.
The Structure That Signals a Completed AMD Correction
The chart shows AMD transitioning from a corrective phase into a potential continuation setup. After a pullback labeled as wave (4), price has rebounded and is now testing the upper boundary of the recent range near the $270 - $280 zone.
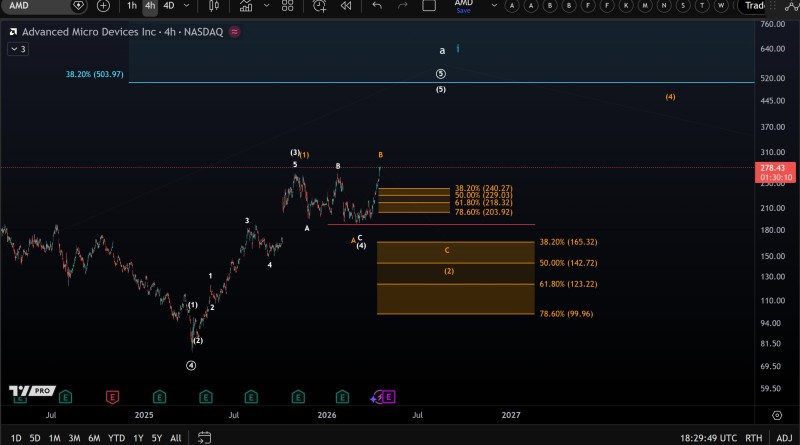
This recovery suggests that the correction may already be behind the market. The move higher is not aggressive, but it is structured - indicating that buyers are attempting to regain control following the prior decline.
Importantly, the chart does not confirm a breakout yet. Instead, it shows price pressing into resistance while maintaining higher lows off the recent bottom.
Why $203.92 Defines the Entire AMD Setup
The $203.92 level is the key line in the current structure. It represents the threshold that must hold to validate the idea that wave (4) has completed.
This level aligns closely with broader market observations where AMD Stock Holds $205 Support Zone After Rally Above $230 - reinforcing the importance of the $200 - $205 region in the current trend structure.
A breakdown below $203.92 would invalidate the bullish interpretation and suggest the corrective phase is still ongoing.
From a technical perspective, several factors define the current picture:
- Price remains above the $203.92 support level
- The structure shows a rebound from the corrective phase
- No confirmed breakdown below key support
- Resistance remains intact near recent highs
AMD Attempts to Resume the Uptrend After 15% Rally
With price pushing higher from recent lows, AMD is attempting to transition back into an impulsive phase. However, confirmation is still required. The chart shows price approaching prior highs but not yet breaking through them - leaving the structure in a conditional state: bullish if support holds, but unconfirmed until resistance gives way.
Recent technical coverage also reflects this kind of setup, where AMD Consolidates Near $207 as Shares Test Key Resistance Level, maintaining its broader trend structure while awaiting a directional catalyst.
The move higher is structured rather than aggressive - indicating buyers are attempting to regain control following the prior decline.
Traders monitoring this setup will also want to reference how AMD Holds Near $236 as Stock Consolidates After 15% Rally, which illustrates the pattern of controlled consolidation that has defined AMD's recent technical behavior.
 Usman Salis


