 Eseandre Mordi

Advanced Micro Devices (AMD) is trading under pressure, stuck below a critical threshold that's preventing any meaningful upside momentum. The stock sits around $234, repeatedly failing to break through the $236.50 resistance zone. Until buyers can push through and hold above this level, the near-term momentum favors sellers.
Technical Setup and Market Context
Trader Vickers recently pointed out that watching ultra-short timeframes like the 1-minute chart can give false signals. A clearer picture emerges when looking at 5-minute and 15-minute intervals, which offer better confirmation of where the trend is actually headed.
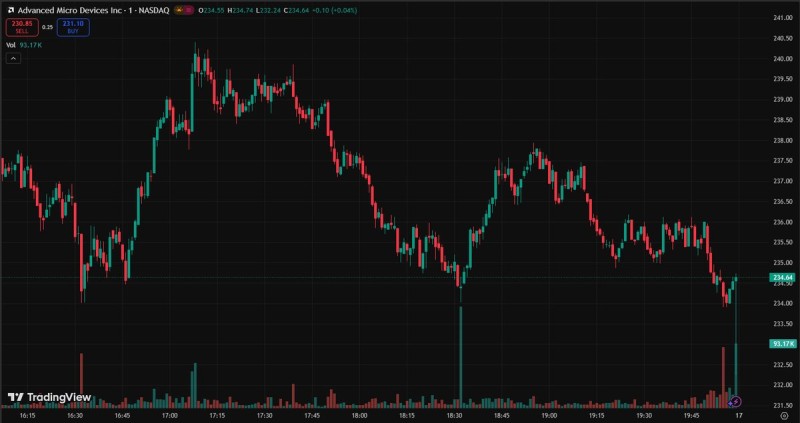
The chart tells a familiar story: AMD keeps trying to punch through $236.50, but each attempt gets slapped down with quick reversals. The stock dipped to around $232.20 before recovering, but the pattern shows sellers are firmly in charge at these upper levels. Volume spikes during selloffs confirm that downward pressure kicks in hard at key turning points.
Key Levels to Watch
- Resistance: $236.50–$237 – Multiple rejections here signal strong selling interest
- Support: $232 – This floor has held up against recent selling waves
- Critical threshold: $232 – Breaking below could trigger a faster drop, while clearing $236.50 would flip momentum back to buyers
Broader Market Context
AMD sits at the heart of semiconductor sector volatility, caught between macro headwinds like interest rate uncertainty and the long-term promise of AI chip demand. While the AI growth narrative remains intact over the long haul, short-term sentiment is cautious as traders navigate choppy conditions across tech stocks.
 Eseandre Mordi


