Peter Smith

⬤ The U.S. trade deficit trend has cooled off compared to the elevated levels seen through 2023 and 2024. The three-month moving average is now "significantly lower" than it was during that stretch. The chart plots the monthly deficit alongside the smoothed average, giving a cleaner read on direction without getting lost in the short-term noise.
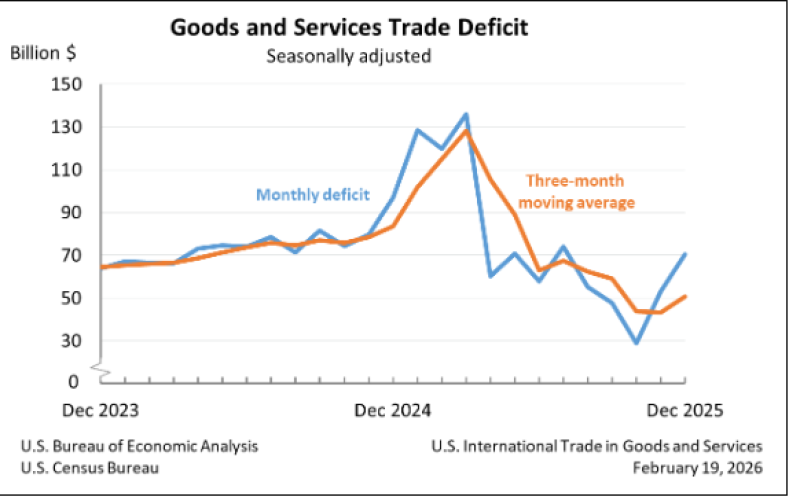
⬤ The data tells a clear story. The monthly deficit climbed steadily through 2024, then spiked hard around the turn into 2025, briefly touching the $120B-$130B range before a sharp pullback - the kind of move that made headlines when the trade gap dropped $6.5 billion to its smallest reading since 2020. After that surge, the three-month moving average rolled over and trended lower through much of 2025, pulling back from the earlier peak range.
⬤ Monthly trade figures are notoriously choppy. The moving average does the work of filtering out those one-month bursts to show where things are actually heading. That broader direction matters because the U.S. trade deficit hit $840B in the first 11 months of 2025 - a number that looks different once you account for the trend moderating from its worst levels.
⬤ None of this means the deficit is small. The U.S. still runs a sizable external gap, and the latest monthly readings bounce around enough to keep markets guessing. But the BEA chart makes one thing clear: the deficit trend is less intense than it was in the 2023-2024 window. For macro watchers, that shift touches everything from growth accounting to currency flows to policy narratives - and with the U.S. $300B+ services surplus now at risk from EU retaliation, the path ahead is anything but settled.
 Peter Smith