 Usman Salis

⬤ A long-range technical chart of the U.S. Dollar Index that first appeared in July 2023 is making the rounds again, completely unaltered from its original form. According to The Long Investor, the setup still holds and matches broader thinking attributed to Ray Dalio about where the dollar might head over the next seven to ten years—though it's not pitched as a short-term trade signal.
⬤ The chart plots DXY inside a massive descending channel that's been in play across multiple market cycles. It layers a smoothed trend line over wave-like price action and lays out two distinct routes forward: a BULL CASE and a BEAR CASE, both staying inside the same long-term channel walls. Fibonacci levels sit at 97.8, 90.6, and 84.7, marking structural zones that could matter if price pushes toward them.
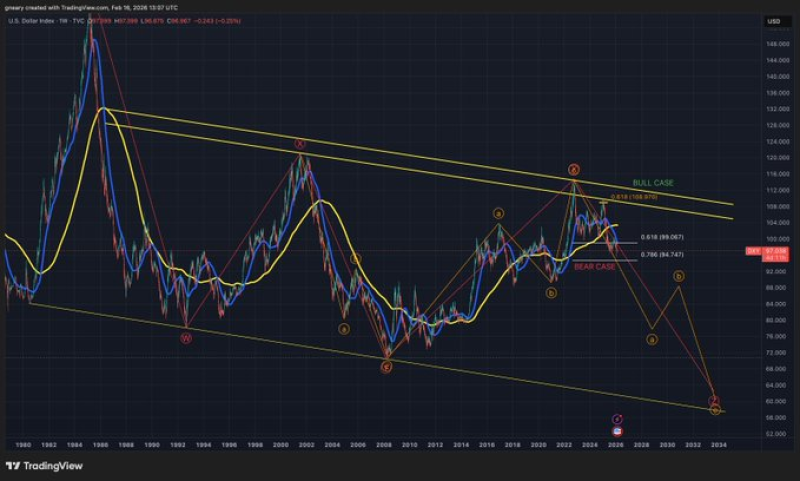
⬤ What stands out is how little has changed. The channel, the scenarios, the reference points—all intact even as DXY has bounced around since then. Right now, the index sits somewhere in the middle of that structure, and the chart suggests the next big move will be measured against those channel edges and Fibonacci bands. Similar long-horizon views on the dollar's technical setup have been explored in pieces like US Dollar Index Drops 1% as 14-Year Support Breaks, where key support levels came under pressure.
⬤ The The Long Investor emphasized that the framework "remains unchanged" despite subsequent market swings, underscoring confidence in the structural boundaries. More recently, DXY Drops to 15-Year Support Level: What's Next for the Dollar in 2026 picked up on similar themes around historical support zones and multi-year dollar trajectory.
⬤ Why it matters: this isn't about calling tops or bottoms tomorrow. It's about watching how DXY behaves around major structural landmarks over years, not weeks. The chart gives traders and macro watchers a roadmap for thinking through long-term dollar strength or weakness without getting pulled into daily noise.
 Usman Salis


