 Marina Lyubimova
⬤ The US dollar just hit a technically crucial zone. The DXY index is now trading right on top of a rising support trendline that's been in place for about 15 years. The year kicked off with the dollar sitting at one of its most overvalued levels ever, but that didn't last long. A sharp selloff has dragged it back down to this long-term support area, and the weekly chart shows it's been tested multiple times recently. That kind of repeated pressure usually means something's brewing.
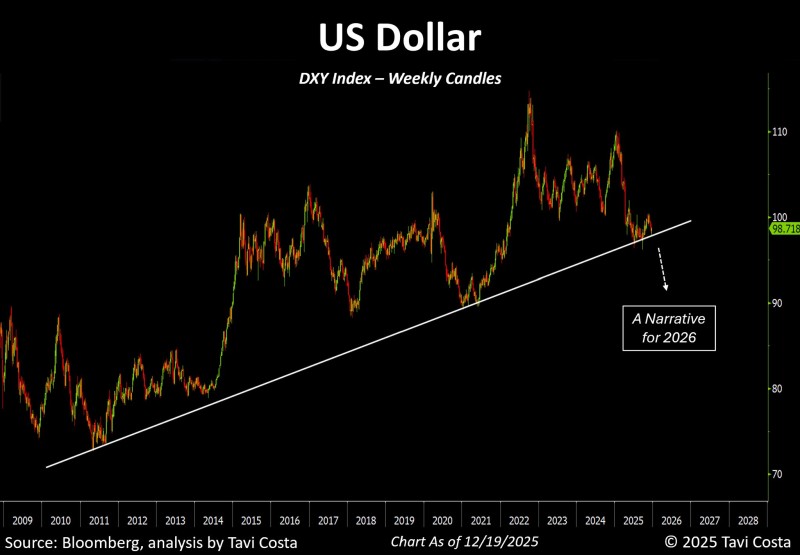
⬤ Looking at the bigger picture, the DXY's multi-decade chart shows an upward-sloping trendline that started forming after the 2008 financial crisis. The index climbed above 110 in recent years, but then reversed hard and dropped all the way back to the 98-100 zone where it's sitting now. The fact that it keeps bumping into this level without bouncing convincingly suggests the pressure is building rather than fading.
⬤ What makes this interesting is what's happening in the background. Central banks in other countries are starting to tighten policy, while the Fed is facing growing pressure to cut rates as US debt servicing costs climb higher. Historically, when you've got big trade deficits and massive government debt, the solution often involves letting the currency weaken over time. That's not exactly a recipe for a strong dollar going forward.
⬤ Why does this matter? The US dollar isn't just another currency—it's the backbone of global liquidity. If the DXY breaks below this 15-year support line and stays there, it could trigger shifts in currency markets, commodity prices, and overall risk appetite. As we head into 2026, how the dollar handles this inflection point could set the tone for volatility across the board.
 Marina Lyubimova


