 Usman Salis

The S&P 500 is sending a conflicting signal: price action shows a relatively contained correction, yet valuation metrics point to a much deeper reset beneath the surface. As Bernt Berg-Nielsen noted, this year's drawdown is significantly smaller than in 2025 - but the drop in forward P/E is nearly identical, highlighting a divergence between price and valuation.
An SPX Correction That Looks Smaller Than It Feels
The chart compares two phases: last year's correction and the current one. In 2025, the index experienced a sharper price decline of roughly -19.5%, while the current drawdown is notably smaller at around -9%.
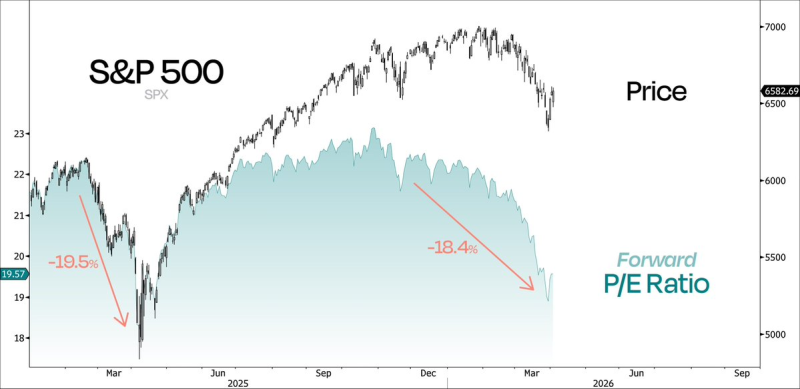
Despite this, the visual structure shows the index still pulling back from highs, with lower highs forming after the peak. The decline appears more controlled, lacking the steep cascading selloff seen in the prior correction - creating the impression of a milder move when viewed purely through the lens of price.
The SPX Valuation Shift Tells a Different Story
While price has not fallen as aggressively, the forward P/E ratio has dropped by approximately -18.4% - nearly matching last year's -19.5% contraction. That alignment is the key signal in the chart.
The shaded area representing valuation compresses sharply even as the price line remains relatively elevated. This suggests the market has undergone a significant repricing without a corresponding collapse in index levels - a combination that is historically unusual and worth paying close attention to.
The forward P/E has contracted -18.4% while price is down only -9% - the market has repriced earnings expectations at nearly the same depth as 2025 without showing it in the headline index.
S&P 500 Volatility Gap Hits 25-Year Extreme adds context for how unusual the internal dynamics of this correction have been, showing how surface-level stability has coexisted with extreme underlying stress - a pattern consistent with the valuation-price divergence the chart is now highlighting.
An SPX Selloff Driven by Repricing, Not Structure
The comparison highlights how unusual the current correction has been. The move is not defined by panic selling or structural breakdown - it is defined by a rapid adjustment in how the market values earnings. The data tells the story clearly:
- 2025 price drop reached roughly -19.5%
- 2026 drawdown is closer to -9%
- Forward P/E contraction is nearly equal in both periods
- Price remains relatively stable compared to valuation compression
SPY Faces 200-Day MA Test as Rejections Mount captures the technical pressure that has been building alongside the valuation reset, showing how the price structure is also deteriorating - just more slowly than the underlying multiple compression would suggest.
Price action near the highs remains relatively orderly without aggressive downside acceleration - the shift is visible in valuation metrics rather than in price extremes, which makes it easier to underestimate.
SPY Elliott Wave Signals Correction Phase Ahead places the current correction within a broader structural framework, raising the question of whether the valuation reset now visible in the data is the entirety of the adjustment - or just the first phase of a more traditional price-driven correction that earnings season may accelerate.
 Usman Salis


