Alex Dudov
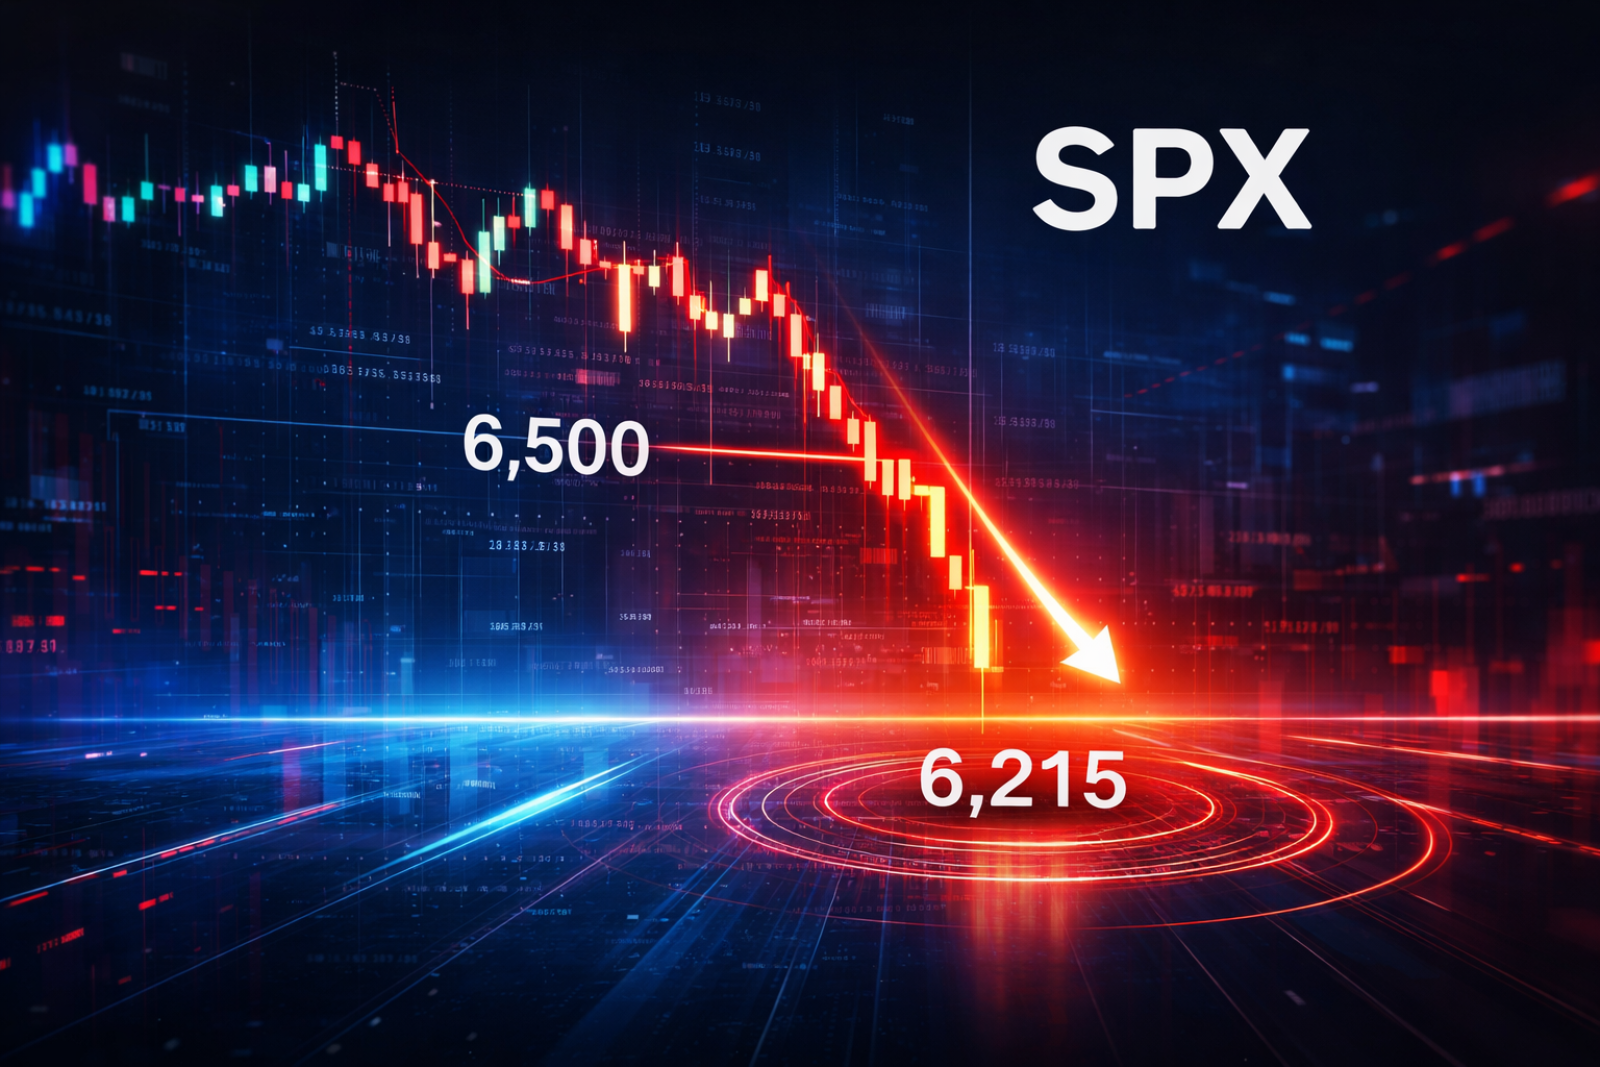
⬤ The S&P 500 is showing clear signs of short-term stress. As analyst Dr. Potassium, SPX is now trading near 6,506, slipping under the first critical support zone. The chart tells a straightforward story: price pulled back from resistance near 7,000 and has entered a corrective structure.
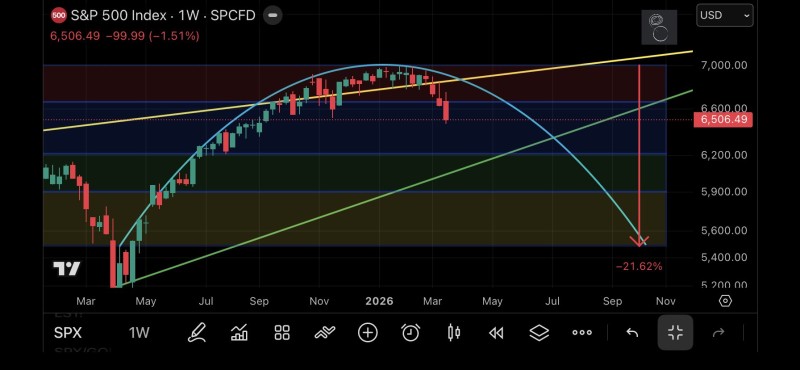
⬤ A rounded top formation is visible on the chart, with price unable to hold higher ground after testing resistance. SPX has dropped into the 6,200-6,600 range, a zone that previously acted as consolidation. Breaking below the upper boundary signals fading buying pressure, a dynamic similar to what was seen in the S&P 500 pullback within broader uptrend, where price rotated lower after resistance contact.
⬤ The 6,215 level is now the number to watch. It aligns with the lower support band on the chart and represents the nearest downside target if selling continues. The setup shares technical parallels with SPX testing 6,970 resistance before reversal, where failure at a key level triggered a corrective leg. A deeper bearish scenario points toward 5,400, a drop of over 20% from recent highs.
⬤ The broader market structure has shifted from upward momentum to correction mode. Sentiment remains sensitive to volatility, and technical signals are aligning with growing uncertainty, a theme also covered in S&P 500 correction signals weakening control, where continued downside risks were flagged. Whether 6,215 holds will set the tone for the next meaningful move.
 Alex Dudov