 Usman Salis
⬤ The S&P 500 is trading just shy of record territory as December winds down, testing what looks like a pretty important resistance zone. The index has been climbing steadily since bouncing back from that April pullback, and now it's knocking on the door of new highs. Market watchers are focused on a tight cluster of technical barriers between 6,958 and 6,972 that could determine whether this rally has more room to run.
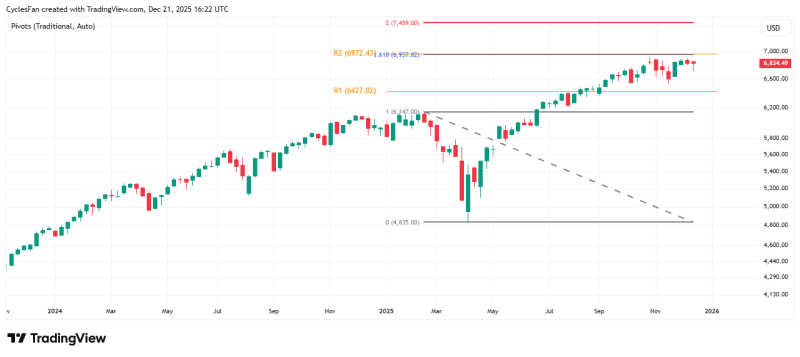
⬤ What makes this area interesting is how multiple resistance levels are stacking up in the same spot. The 1.618 Fibonacci extension from April's decline lines up almost perfectly with the R2 pivot point right around 6,970. When you see technical levels converging like that, it tends to create a stronger ceiling for prices to push through. The chart shows a clean pattern of higher highs and higher lows over the past several months, which tells you momentum has been pretty consistent on the upside.
⬤ Here's where it gets conditional though. Just touching that resistance isn't enough—the S&P needs to actually close above 6,972 on a weekly basis to confirm it's broken through. Without that weekly close, prices could easily stall out or pull back from current levels. But if we do get that confirmation, the next target on the radar is way up at 7,460, which corresponds to the 2.0 Fibonacci extension. That's not expected until sometime in 2026, so we're talking about a longer-term projection here.
⬤ The S&P 500 basically sets the tone for equity markets globally. When it pushes to new all-time highs, it signals healthy risk appetite and usually supports momentum across other assets. A clean breakout would validate the current uptrend and likely keep bulls in control heading into next year. On the flip side, if resistance holds and prices get rejected here, we could see the market go sideways for a while at these elevated levels. Either way, the next few weekly closes are going to be critical for understanding where momentum is really headed into 2026.
 Usman Salis


