 Eseandre Mordi

⬤ The S&P 500 kicked off 2026 with a winning January, putting the spotlight back on a powerful seasonal pattern that's held up for decades. When January finishes in the green, the rest of the year tends to follow suit—and the numbers back it up in a big way.
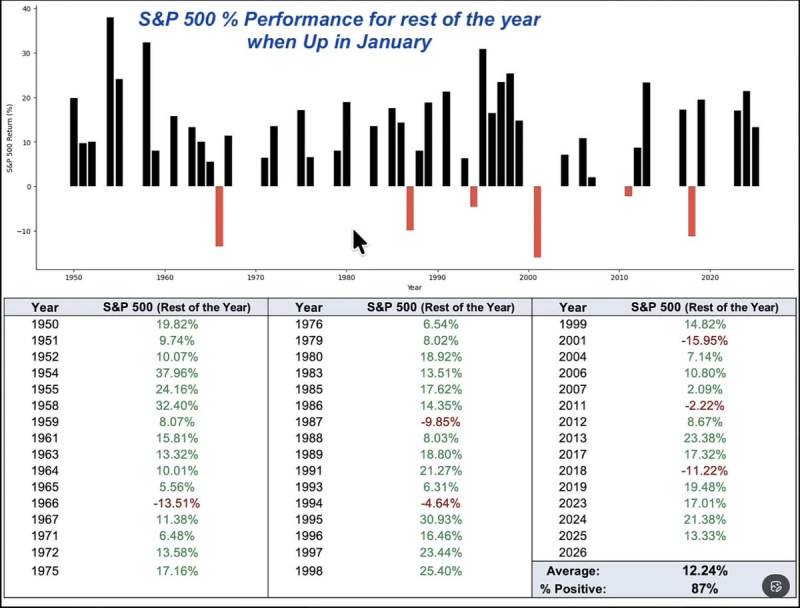
⬤ The data tells a compelling story: 87% of years with a positive January went on to post gains through December. Even better, the average rest-of-year return in those cases hit 12.24%. Looking at individual years since 1950, the pattern is clear—positive Januarys have overwhelmingly led to more upside rather than reversals.
⬤ The chart references other well-known seasonal indicators that paint a similar picture. The January Barometer suggests full-year returns averaging around 17% when the first month is positive. Meanwhile, the Bullish Turn-of-the-Year Barometer points to roughly 16% average returns over the following 12 months after strong early January trading.
While seasonal tendencies don't determine outcomes, the consistency of this relationship over decades provides a useful reference for evaluating current market strength.
⬤ Sure, there have been exceptions where positive Januarys didn't guarantee yearly gains, but they're rare. What makes this pattern matter is how consistently early momentum has translated into sustained performance. When the S&P 500 starts strong, it typically signals conditions that support continued gains through the rest of the year—a trend that's proven remarkably durable across different market environments.
 Eseandre Mordi


