 Sergey Diakov

⬤ The NASDAQ 100 has bounced back from the bottom but now finds itself trapped in a tight range just below a major resistance zone. The index keeps testing the upside near 25,300 but can't punch through, while support underneath continues holding firm. This creates a classic breakout setup where the market is coiling before its next move.
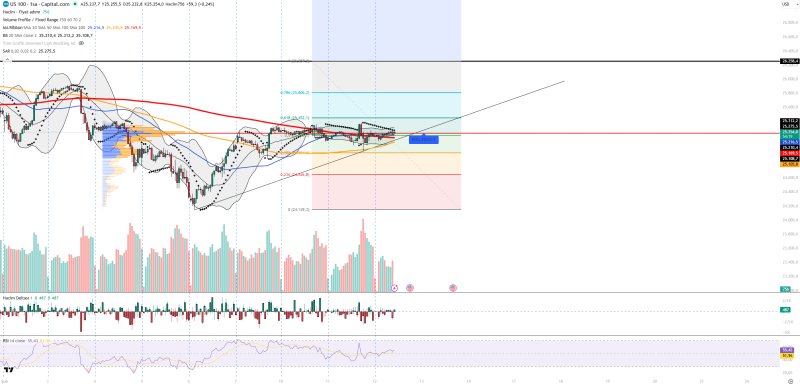
⬤ Technical indicators paint a cautiously optimistic picture without screaming conviction either way. RSI is hovering around 51–55, sitting right in neutral-to-slightly-positive territory. Volume is average at best, meaning neither buyers nor sellers are showing up in force. The Volume Profile center sits at 25,251, marking where most trading has happened, and volume delta is only marginally positive—buying pressure exists but isn't overwhelming. Bollinger Bands are tightening up with price above the middle band, while Parabolic SAR dots remain below price, confirming the rebound structure is still alive.
⬤ The battleground is clearly marked. Support levels sit at 25,207, 25,108, and 24,974. Resistance checkpoints come in at 25,312, 25,432, and 25,806. This puts the NASDAQ 100 in a narrow decision zone where a clean break above resistance would flip the short-term script bullish, while a drop back through support would reopen the door to lower levels. Similar price compression patterns were recently covered in NASDAQ 100 breaks resistance after extended consolidation.
⬤ What happens next depends heavily on U.S. interest rate expectations and whether risk appetite stays strong for tech-heavy indexes. Recent analysis has tracked positioning shifts through pieces like Nasdaq 100 ETF shows strong rebound after 1%+ drops and QQQ stock news: $19M put bet signals market caution, both highlighting how fast sentiment can flip once these tight ranges finally break.
 Sergey Diakov


