Peter Smith

The U.S. Dollar Index is approaching a critical resistance zone after a sustained upward move, with price now testing the 100.4 region. The structure appears to be completing a five-wave impulse, suggesting a corrective phase may be imminent - a pattern that veteran financial trader Matthew Dixon has been tracking closely.
DXY Rally Builds From 96.5 With Higher Highs
The chart shows a steady advance from the lows near 96.5, forming a sequence of higher highs and higher lows. This structure aligns with a classic five-wave impulse pattern, where momentum builds progressively with each leg.
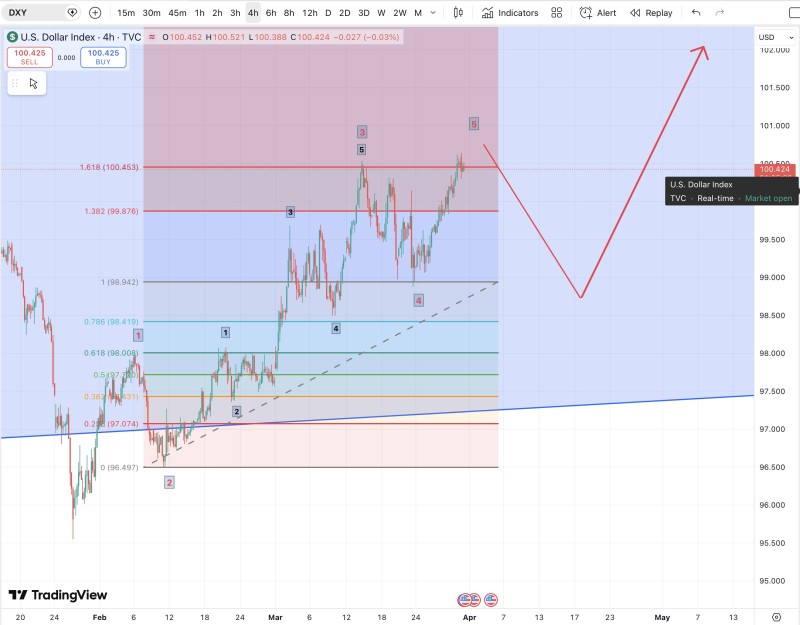
Price has now reached a key extension zone near 100.4, which is marked as a potential exhaustion area. Similar behavior has been observed in recent DXY setups, where rallies stall near the 100 level - a historically significant resistance zone.
The move into this region suggests that the current bullish leg may be nearing completion.
Why the 100-100.5 Dollar Resistance Zone Matters
The area around 100-100.5 has repeatedly acted as a ceiling for the dollar. The chart reflects price testing this zone after an extended move higher, increasing the likelihood of a reaction.
The 100 level remains a line in the sand for dollar direction - repeated tests of such levels often lead to either a sharp rejection or a breakout that defines the next trend phase.
In broader technical analysis, repeated tests of key resistance levels often lead to either a sharp rejection or a breakout that defines the next trend phase. At this stage, price behavior at this resistance will determine whether the trend pauses or continues.
Corrective Three-Wave Pullback Expected Near DXY 100 Level
According to the wave structure outlined, the next expected move is a three-wave correction lower. This would follow the completion of the five-wave impulse and represent a standard Elliott Wave sequence.
A pullback from this zone could align with strength in Bitcoin and other risk assets - this type of corrective phase does not invalidate the broader bullish trend but instead resets momentum.
The chart projects a pullback toward lower support zones before a potential continuation higher. The 100 level has already seen multiple rejections, reinforcing the significance of the current setup.
The Signal Traders Are Watching Now
The focus now is on whether DXY begins to reject from the current resistance zone. A confirmed pullback would validate the completion of the impulse structure and signal a transition into correction.
Longer term, the broader structure may still favor upside continuation after the correction phase - consistent with patterns where the dollar resumes strength following consolidation.
For now, the index sits at a decision point. The 200EMA near the critical 100 level adds another layer of confluence, where resistance, structure, and momentum converge to define the next move.
 Peter Smith