Usman Salis

The U.S. Dollar Index has been one of the most closely watched charts in macro trading this year — and right now, it's sitting at exactly the level that matters most. After a sharp drop that took DXY all the way down to the 96–97 zone, the index has quietly clawed its way back, and now it's knocking on the door of $100 again.
That $100 level isn't just a round number. It's where trendlines converge, where the 50 EMA on the weekly sits, and where every recent rally has stalled out. But this time, something looks different. Instead of rolling over, DXY is grinding higher — forming higher lows, absorbing selling pressure, and holding its structure intact beneath resistance.
The question traders are asking right now: is this another rejection in the making, or is the dollar finally ready to break out?
DXY Bounces Off 50 EMA, Forms Bullish Pattern Near $96–97
Despite repeated failures to break higher, the dollar continues to form higher lows, signaling that buyers remain in control beneath a key macro ceiling. As highlighted by $Trader, the current structure reflects digestion rather than weakness, with the market holding firm after a bullish reversal signal at dynamic support.
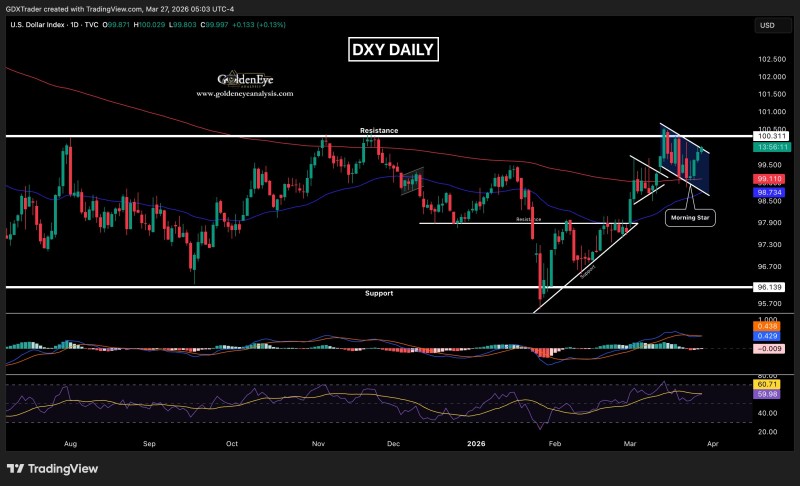
The daily chart confirms that DXY recently bounced from the 50 EMA near the 96–97 region, where a clear morning star pattern formed — typically associated with short-term reversals. That reaction marked a shift in behavior, transitioning from a corrective phase into a constructive uptrend.
The current structure reflects digestion rather than weakness, with the market holding firm after a bullish reversal signal at dynamic support.
Since then, price has advanced steadily toward the $100 level, forming a sequence of higher lows. Instead of sharp rejections, DXY is consolidating just beneath resistance, indicating underlying strength. A similar setup was observed in U.S. Dollar Index Tests Key 200EMA Near the Critical 100 Level, where sustained pressure below $100 preceded a potential breakout attempt.
The DXY Pattern Building Beneath $100 Resistance
Price action on the daily timeframe is forming a bullish flag structure, defined by a strong impulsive move followed by controlled consolidation.
This structure includes:
- A strong recovery from the 96 support zone
- A tightening range beneath $100 resistance
- Consistent respect of rising short-term support
Rather than distributing lower, price continues to compress upward, with each pullback being absorbed. This reinforces the interpretation that the market is pausing, not reversing.
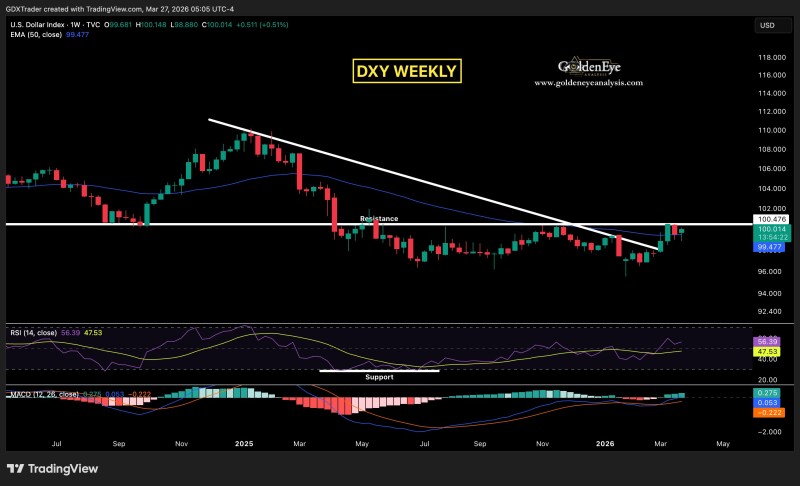
The $100 level is not just psychological — it is structurally significant across timeframes. On the weekly chart, DXY is testing a descending trendline that has capped rallies since 2024, while simultaneously attempting to reclaim the 50 EMA. This creates a confluence zone where multiple technical factors converge.
Repeated failures at $100 have been well documented — the 100 zone has consistently acted as a ceiling, with price stalling after each attempt to break higher.
Repeated failures at this level have been well documented. As noted in DXY Rejected at Resistance as U.S. Dollar Index Tests Key 100 Level, the 100 zone has consistently acted as a ceiling. However, what's different now is the structure beneath resistance — instead of forming lower highs, DXY is holding its ground and maintaining pressure just below the breakout point.
Where U.S. Dollar Index Momentum Quietly Builds
Momentum is gradually shifting in favor of buyers, even without a confirmed breakout. On the weekly timeframe, price is stabilizing above key support while pressing into resistance, suggesting a transition from a bearish structure toward a neutral-to-bullish phase. The broader context aligns with observations in U.S. Dollar Index Holds 14-Year Uptrend Support, where repeated defenses of major trendlines reinforced long-term strength in the dollar.
At this stage:
- Higher lows remain intact
- The 50 EMA continues to act as dynamic support
- Resistance at $100 is under sustained pressure
A confirmed break above $100 would likely trigger continuation and shift the broader structure decisively higher.
This combination reflects a market coiling beneath a key level. A confirmed break above $100 would likely trigger continuation and shift the broader structure decisively higher. Until then, the current price action continues to reflect controlled consolidation rather than weakness.
 Usman Salis