 Victoria Bazir
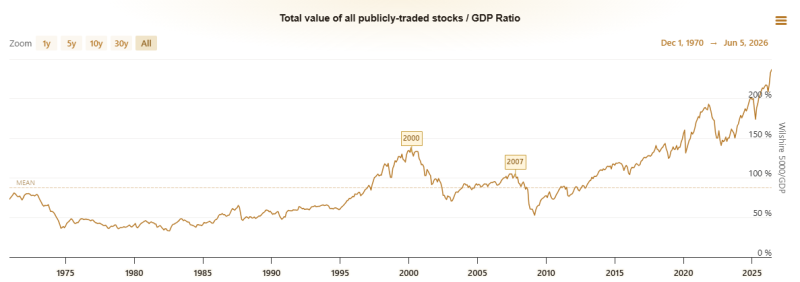
The metric compares the value of publicly traded U.S. equities with the size of the U.S. economy. Warren Buffett once described it as one of the most useful broad measures of market valuation.
Previous peaks now look modest by comparison:
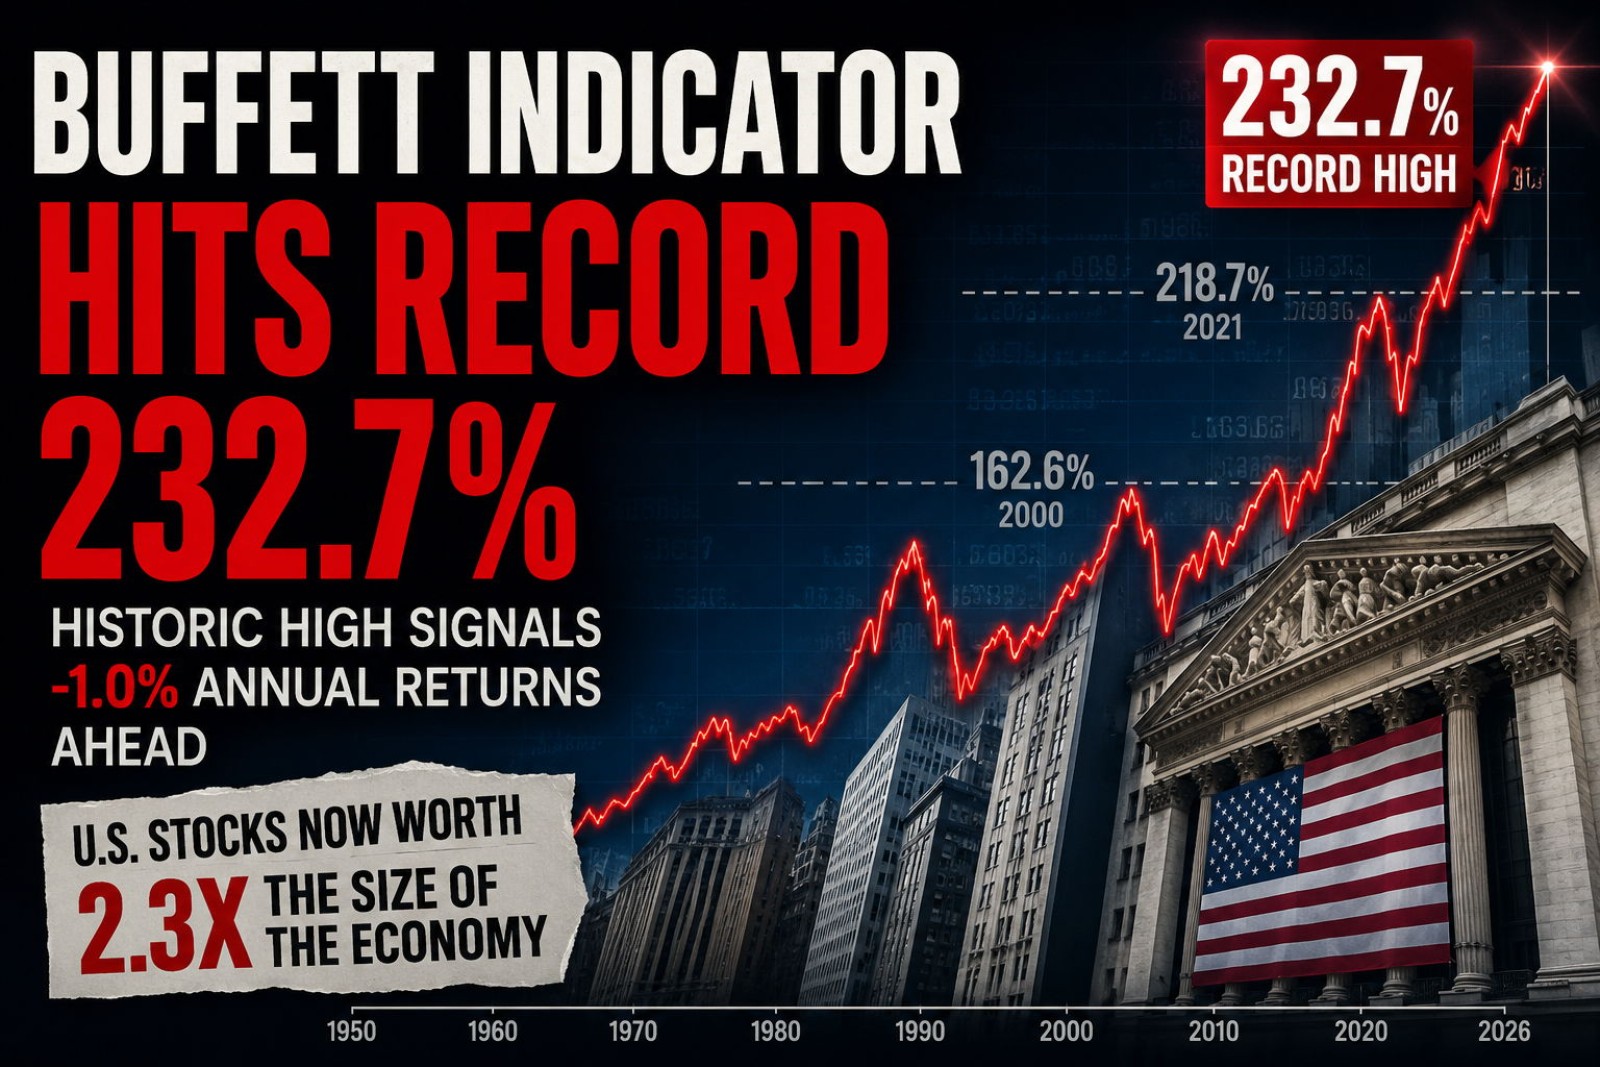
- 162.6% during the dot-com bubble in 2000
- 218.7% during the post-pandemic market surge in 2021
- 232.7% in Q1 2026
The question is no longer whether U.S. stocks are expensive. The question is whether future earnings growth can justify current prices.
A Market Worth More Than Twice the Economy
The latest reading means the value of publicly traded U.S. equities exceeds annual U.S. GDP by more than two times. That gap has never been wider.
The indicator spent most of the second half of the twentieth century below 100%. It crossed 150% during the dot-com era, fell after the crash, then resumed a long upward trend that accelerated after 2020.
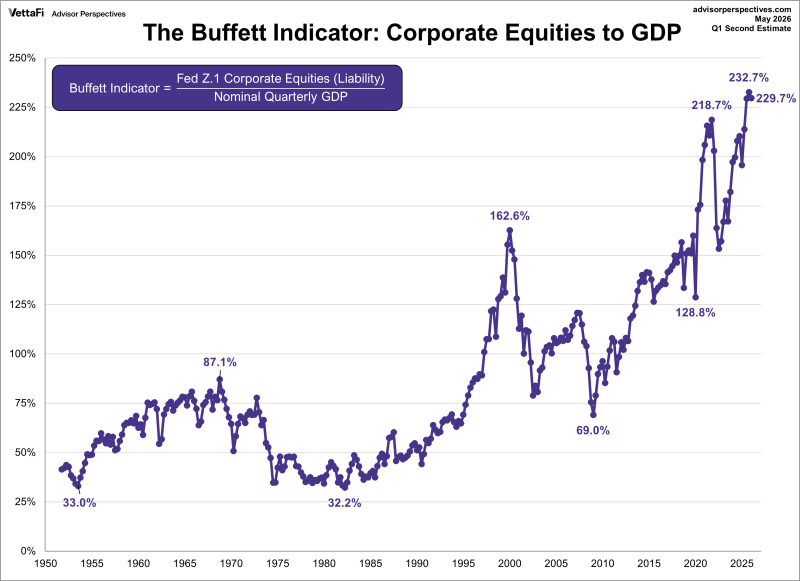
The historical comparison is striking. The peak of the dot-com bubble reached 162.6%. Today's reading stands roughly 70 percentage points higher.
Why Historical Comparisons Have Become More Difficult
The structure of the stock market has changed dramatically over the past several decades. Large U.S. corporations generate substantial revenue outside the United States, while the denominator in the Buffett Indicator remains domestic GDP.
At the same time, corporate balance sheets have become less dependent on physical assets and increasingly driven by software, intellectual property, networks and services. Profit margins are also significantly higher than historical averages.
These changes help explain why the Buffett Indicator has followed a persistent upward trajectory since the 1980s.
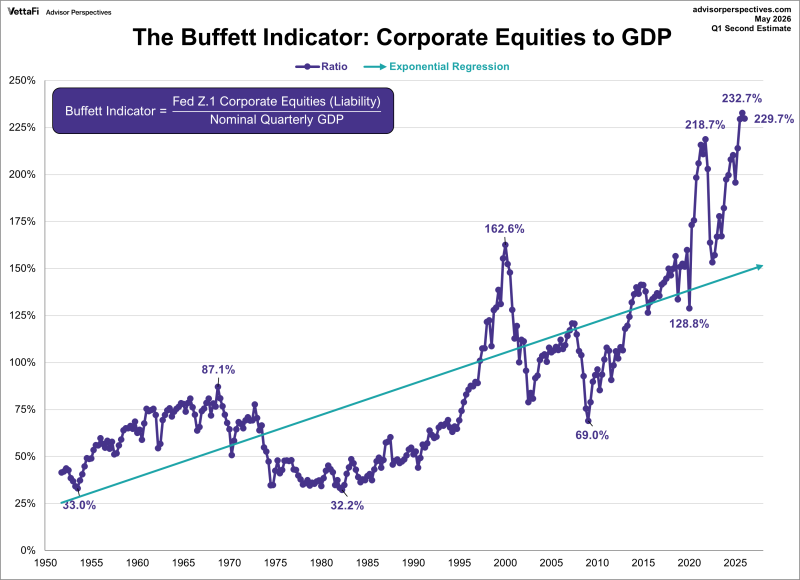
The long-term trend line suggests that part of the increase reflects structural shifts in the economy rather than speculation alone. A reading above 200% today does not carry exactly the same meaning as it would have several decades ago.
The More Important Chart
The trend argument explains part of the move. It does not explain all of it. Advisor Perspectives' detrended version of the Buffett Indicator removes the long-term trend and measures how far valuations sit above or below their historical baseline.
The current reading is 64.9% above trend. That places the market inside the model's "Strongly Overvalued" zone.
For comparison:
- Dot-com peak: 79.1% above trend
- Current cycle: 64.9%
- Financial crisis trough: -34.5%
- Early-1980s trough: -52.5%
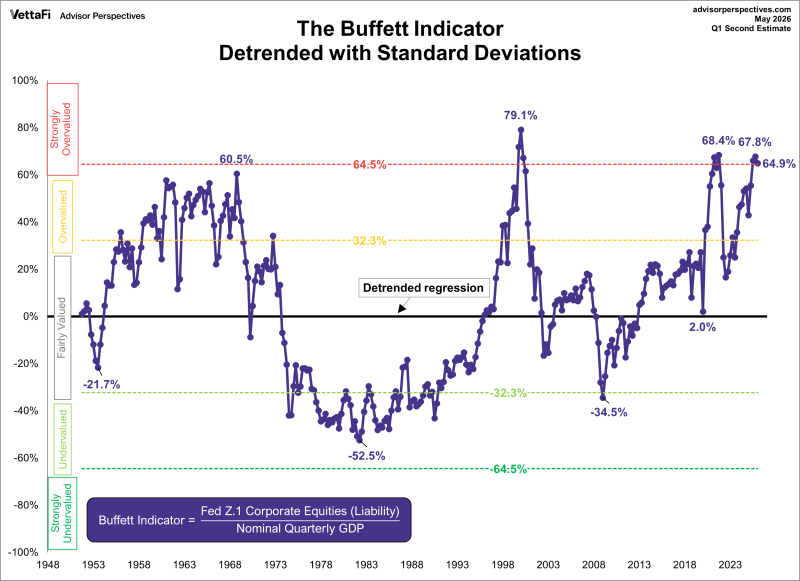
After adjusting for long-term structural changes, current valuations remain among the highest levels ever recorded. The gap versus 2000 narrows, but it remains historically extreme.
Stocks and GDP Are Moving at Different Speeds
The latest reading reflects a widening gap between financial markets and economic output. U.S. GDP has continued to grow steadily over time, reaching new highs in recent years. Equity valuations, however, have expanded at a much faster pace.
This divergence is the foundation of the Buffett Indicator's record reading. Economic growth has been strong. Asset prices have grown even faster.
The Real Warning Is Not a Crash
The Buffett Indicator has never been a reliable timing tool. It did not identify the exact peak in 2000. It did not signal the bottom in 2009. It remained elevated for years before several major market corrections.
What it has historically done better is estimate future return potential. According to the latest Advisor Perspectives model, current valuation levels imply approximately -1.0% annualized returns over the long run, including dividends.
A separate version of the model produces a similar estimate of -1.1%. These figures are not forecasts for the next quarter or the next year. They suggest that investors entering the market at historically extreme valuation levels may face a period of below-average returns even if economic growth continues.
Can Current Valuations Be Sustained?
That depends on whether corporate earnings continue expanding fast enough to support existing multiples. If profits grow faster than expected, valuations can gradually normalize without a major decline in stock prices. If earnings growth slows, the adjustment may come through lower valuations, weaker returns, or a combination of both.
Markets do not always correct through crashes. Sometimes they correct through years of stagnant performance while fundamentals catch up.
 Victoria Bazir


