 Sergey Diakov
The total U.S. M2 money supply has climbed to an unprecedented $22.2 trillion, marking a significant milestone in the American financial system. After experiencing a brief contraction in 2023–2024, liquidity expansion has resumed its long-term trajectory, raising important questions about inflation dynamics, credit availability, and the evolving stance of monetary policy.
Chart Analysis: Growth Resumes After Brief Decline
The M2SL.RP monthly chart from Barchart trader reveals a multi-decade expansion pattern that's hard to ignore. From the early 1990s through 2019, the money supply grew at a relatively steady pace. Then came the pandemic era of 2020–2021, when unprecedented fiscal stimulus and Federal Reserve interventions caused M2 to spike dramatically.
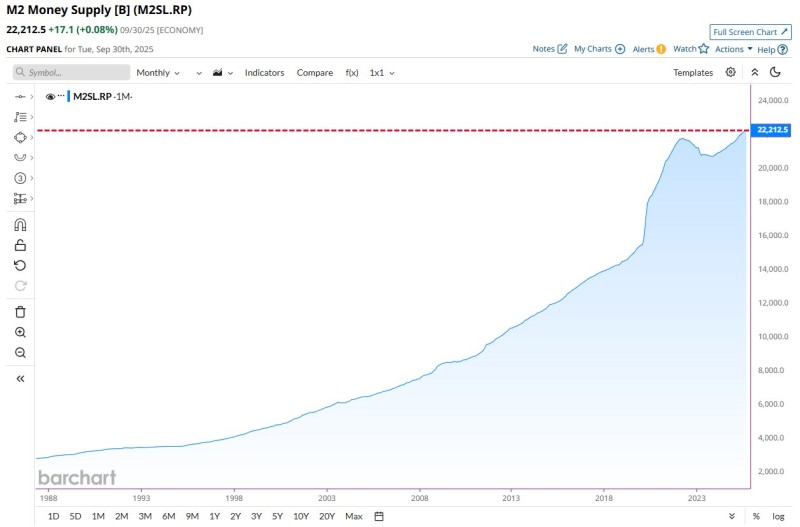
The measure peaked near $21.7 trillion in 2022 before the Fed's aggressive rate hikes and quantitative tightening temporarily reversed the trend. By late 2025, however, the picture has changed again. M2 now sits at $22.2 trillion, exceeding all previous records and suggesting that monetary conditions are loosening despite the Fed's stated commitment to restrictive policy.
What This Means for the Economy
M2 includes physical currency, checking accounts, savings deposits, and money market funds, making it one of the most comprehensive measures of available liquidity. History shows that rapid M2 growth often precedes higher inflation, stronger asset prices, and easier financial conditions. The current environment presents a complex picture. Interest rates remain elevated as the Fed tries to prevent inflation from reigniting, yet government spending continues to pump money into the system. Meanwhile, money velocity, which measures how quickly dollars change hands, remains relatively low, potentially limiting immediate inflationary pressure. What we're seeing is essentially a standoff between fiscal expansion and monetary restraint, with liquidity proving more resilient than many expected.
Key Factors Driving M2 Growth
- The Federal Reserve maintains elevated policy rates to anchor inflation expectations
- Government deficit spending sustains high levels of liquidity flowing into the economy
- Money velocity remains subdued, creating a buffer against immediate inflation risks
- Credit markets and risk assets benefit from the renewed liquidity environment
- The shift suggests structural factors are overriding tight monetary policy
Looking Ahead
The record $22.2 trillion M2 reading tells us that liquidity hasn't disappeared from the financial system, it's simply evolved. While the expansion isn't as dramatic as the 2020 surge, the steady climb indicates that restrictive monetary policy is gradually being offset by other forces driving liquidity growth. This matters for credit markets, equities, and potentially future inflation cycles. For anyone watching the markets, the message is clear: liquidity drives price action, and right now, it's flowing again.
 Sergey Diakov


