Alex Dudov

US inflation is showing signs of re-acceleration in April, and the timing matters. After a steady decline through late 2025 and into early 2026, real-time data is now pointing to a noticeable rebound driven by energy and consumer-related categories. According to Truflation, multiple categories experienced a re-acceleration in April, led primarily by gasoline and fuel prices, while clothing and recreational spending also continued to climb.
The move interrupts what had been a clear cooling trend - suggesting price pressures may be stabilizing rather than continuing lower.
After months of decline, inflation is now trending higher into April, with momentum building across several categories.
US Inflation Rebounds from Sub-1% Lows After a Cooling Phase
The latest data places US inflation at 1.84%, up from 1.26% at the start of the month. The chart picture tells a clean story: a steady decline through late 2025 into early 2026, followed by a clear bottoming structure and a subsequent rebound into April.
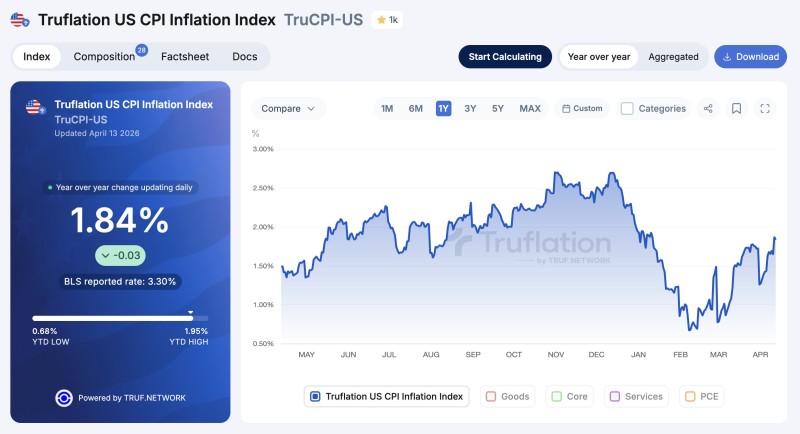
This pattern aligns with previous trends seen in real-time inflation data, where readings dropped toward sub-1% levels before stabilizing and turning higher again. As covered in US CPI at 0.94%: Truflation Data Shows Inflation Cooling, those lower readings reflected a genuine cooling phase - one that now appears to have run its course.
The current move higher reflects a shift in short-term momentum rather than a return to prior highs.
Energy and Consumer Categories Drive April's Inflation Move
Gasoline and fuel prices are the largest contributors to the recent increase - a reminder of how sensitive overall inflation remains to energy fluctuations. At the same time, continued increases in clothing and recreational categories suggest that price pressures are not isolated to one corner of the economy.
The rebound is appearing across both volatile and non-volatile components, which is consistent with periods where inflation picks up after a cooling phase.
This broad participation is a key detail. When only energy moves, the signal is easier to dismiss. When consumer categories join the move, the picture becomes harder to ignore. Earlier data tracked in Truflation US CPI Shows Inflation at 0.86% illustrated just how far readings had fallen - context that makes the current rebound more significant.
US Inflation Momentum Shifting: A Rebound, Not a Breakout
Despite the recent rise, inflation remains below the peaks seen late last year, when readings moved closer to the mid-2% range. The chart structure shows a rebound from a local bottom rather than a confirmed breakout into a new higher trend. This places the current move in a transitional zone - strong enough to signal change, but not yet decisive.
The disinflation trend has paused. Whether this becomes a sustained uptrend will depend on whether the current move continues or stalls near current levels.
For broader context on what a renewed inflation upturn could mean for monetary policy, US Inflation Index Rises Again, Fed Rate Cuts in Doubt outlines the potential implications for rate expectations going forward.
The directional shift is the key takeaway here. After months of decline, April is delivering a clear signal: the disinflation trend has paused, and short-term pressure is returning across multiple categories. Whether it holds will become clearer in the weeks ahead.
 Alex Dudov