Saad Ullah

The U.S. consumer is entering 2026 on weaker footing than many expected. As Global Markets Investor noted, real after-tax income growth has slowed sharply while the personal savings rate has also declined. The chart confirms this trend, showing both indicators trending lower over time and leaving households with less financial cushion.
A Steady Erosion in US Consumer Income Growth
The chart highlights a clear downward trend in real after-tax income growth on a 3-month moving average basis. From around 3.0% year-over-year in mid-2024, the data gradually declines into early 2026, reaching roughly 1.3%.
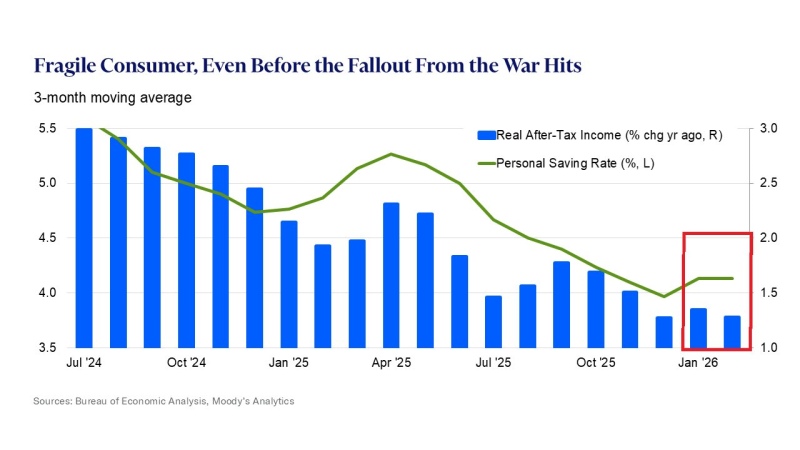
This is not a sudden breakdown but a persistent slowdown, with each rebound failing to reclaim prior highs. The structure forms a sequence of lower highs - indicating that income growth momentum has been consistently weakening over multiple quarters rather than experiencing a one-off dip.
Real income growth continues to weaken in a pattern that is increasingly difficult to dismiss as noise - the multi-quarter deterioration from 3.0% to 1.3% represents a structural deceleration that changes how much households can spend without drawing down reserves.
US Savings Rate Falls Alongside Slowing Income
At the same time, the personal savings rate follows a similar downward path. Starting near 5.5%, it trends lower across the period and settles near the lower end of the range by early 2026. The chart's most recent segment shows only modest stabilization rather than a meaningful recovery:
- Real after-tax income growth: ~3.0% down to ~1.3%
- Personal savings rate: ~5.5% down to near recent lows
- Both metrics declining into 2026 simultaneously
The declining savings rate pressures households in a way that makes the income slowdown more consequential - when savings fall at the same time as income growth decelerates, the financial cushion that would normally absorb shocks is shrinking from both directions at once.
A Narrowing US Consumer Cushion Heading Into 2026
The combination of slowing income growth and a declining savings rate points to a tightening financial position for households. The chart does not show a reversal in either trend - income remains near its lows and savings have yet to recover meaningfully.
This creates a fragile setup where consumers have limited room to absorb further pressure. External data has also pointed to a similar imbalance between income and spending, where households increasingly rely on reduced savings to maintain activity - a dynamic that is sustainable only until the savings buffer runs out.
U.S. consumer shows signs of slowing growth across multiple indicators simultaneously - and the structure visible in the chart reflects a gradual weakening rather than a sharp break, which makes it easier to overlook quarter by quarter but harder to ignore when viewed across the full multi-quarter trend. With both key indicators moving lower, the consumer backdrop appears increasingly constrained as the trajectory carries into 2026.
 Saad Ullah