Eseandre Mordi

Inflation is no longer trending lower - it has stalled at a level that keeps policy pressure intact. Core PCE came in at 3.0% in February, extending a streak of readings above the Federal Reserve's 2% target and reinforcing concerns that disinflation has lost momentum.
The Core PCE Downtrend That Lost Control
The chart shows a clear transition in structure. After peaking near 5.6% in 2022, Core PCE inflation moved into a steady downtrend through 2023. That decline, however, flattened out during 2024 and into 2025.
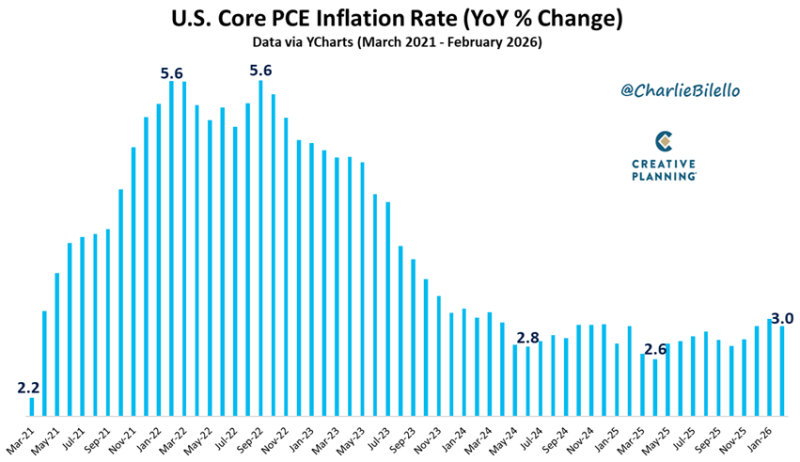
As Charlie Bilello noted, the latest 3.0% reading marks the 60th consecutive print above the Fed's target. The structure now reflects a shift away from consistent cooling:
- The sequence of lower highs has stalled
- The range between ~2.6% and 3.0% has held for months
- Recent readings show stabilization near the upper bound
The 60th consecutive print above the Fed's 2% target is not just a streak - it is a structural signal that the disinflation phase has paused rather than continued.
US Core PCE Hits 3.0% and GDP Slows to 1.4% in Q4 2025 captured the earlier stage of this stall, showing how the combination of sticky inflation and slowing growth has been building into a policy dilemma well before the latest reading confirmed it.
A Core PCE Range That Refuses to Break
From a technical perspective, the chart is no longer trending - it is compressing within a defined range. The repeated inability to break below ~2.6% establishes a firm support zone, while 3.0% acts as a ceiling that is being retested.
The latest move back to 3.0% places inflation at the top of this range again. Structurally, this reflects persistent pressure rather than relief, with no clear continuation of the prior downward trend visible in the data.
U.S. GDP Q4 2025 Slows to 1.4% - Growth Holds But Cracks Are Showing reinforces the tension policymakers now face: inflation holding near the upper end of its range while growth simultaneously decelerates - a combination that leaves little room for either rate cuts or further tightening without trade-offs.
The Signal Embedded in the Core PCE Structure
The key takeaway from the chart is not just the level of inflation, but its behavior over time. A transition from declining prints to sideways movement near elevated levels indicates that underlying pressures remain intact even as the headline numbers appear stable.
US Inflation Data Holds as Shutdown Blocks Reports adds context around the data quality surrounding recent prints, showing how reporting disruptions have complicated the Fed's ability to read the trend clearly - making the 3.0% stall even harder to interpret with confidence.
The next directional move - either a break below 2.6% or a sustained push above 3.0% - will define whether the stalled trend resumes lower or reverses back toward the highs.
With inflation holding near the upper end of its range, the next directional move in either direction will determine whether the Fed's patience on rates was justified or whether the 60-month streak above target ultimately forces a policy response that markets are not yet fully pricing in.
 Eseandre Mordi