 Eseandre Mordi

⬤ XRP shows a possible buy setup on the weekly chart because the TD Sequential indicator now indicates a reversal close to $2.08. The indicator fired after multiple weeks of price drops - traders watch to see if momentum turns. The latest weekly candle sticks to its narrow range as buyers and sellers probe each side.
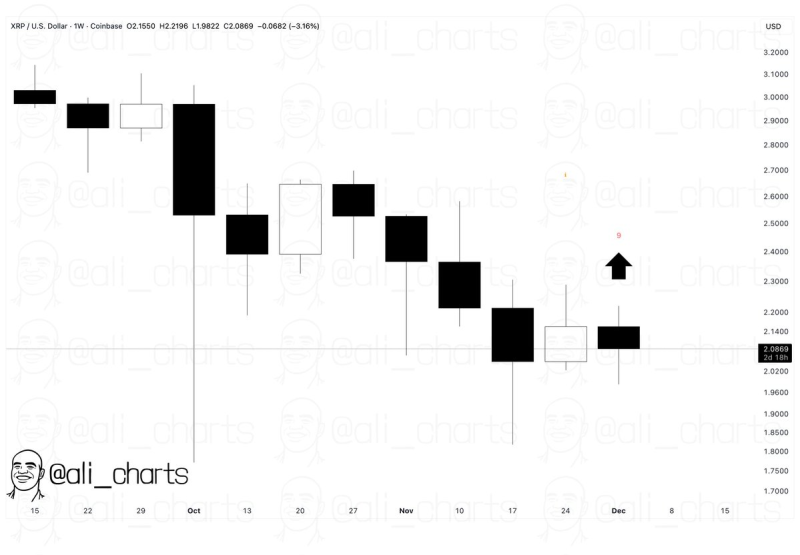
⬤ The chart shows XRP traded between about $1.98 and $2.22 this week after it fell from above $2.40. The TD Sequential signal arrived right after that long slide, which fits the usual pattern - the indicator marks when a trend tires. An upward arrow on the chart hints that sellers lose strength.
The TD Sequential buy signal that appears now may mark a key turn for XRP.
⬤ Through November XRP printed a chain of lower highs and lower weekly closes, which shows momentum drained away. With the TD Sequential buy signal active, traders watch to see if XRP stays near the present level or moves back toward $2.20. Those price zones stay important for the wider structure.
⬤ TD Sequential signals often tilt sentiment when a trend runs out of energy. For XRP, this buy signal that follows steady drops may pull more eyes to the market as participants judge whether conditions favour a rebound.
 Eseandre Mordi


