Peter Smith

Trading around $1.35, XRP is parked right on a long-term ascending trendline that has held consistently since the last cycle low. Price recently pulled back from the $2.00–$2.20 range and is now stabilizing in the $1.30–$1.40 zone. As analyst EGRAG CRYPTO points out, the market is at a transition point that closely mirrors previous cycle behavior, where technical signals aligned with major bottoms.
Above the current price, the $1.80 level is acting as a short-term structural ceiling. Below, the long-term trendline continues to provide a floor. That combination is squeezing price into a tighter and tighter range, and historically, that kind of compression doesn't last long before something gives.
XRP's Moving Average Crossover Has Called 2 Major Bottoms
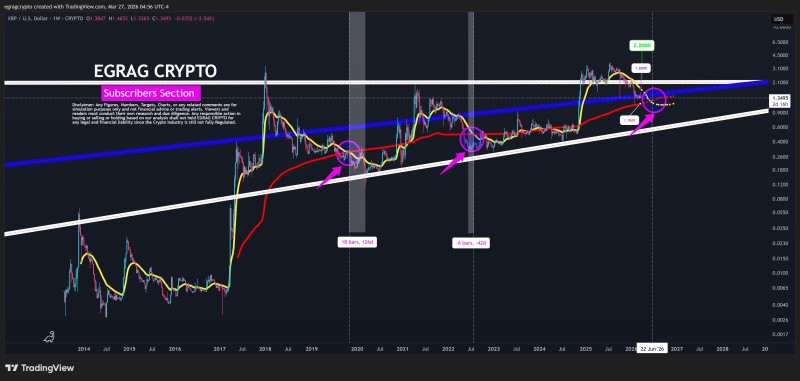
One of the more compelling signals on EGRAG's chart is the interaction between the yellow and red moving averages. This crossover doesn't pinpoint the exact low, but it has consistently defined the broader bottoming zone across two full cycles.
The chart shows XRP is once again at a transition point similar to previous cycles, where technical signals aligned with major bottoms.
The historical data backs that up. In 2018, the cycle bottom formed roughly 126 days after the crossover. In 2022, it formed approximately 42 days before the crossover. In both cases, the signal marked the window where bearish pressure was fading and accumulation was beginning. That same crossover is appearing again now.
Similar structural behavior was explored in XRP Price Near $1 Support as Key Test Looms, where price compression near key support preceded an expansion phase.
XRP Needs a Weekly Close Above $1.80 to Confirm Strength
The chart gives clear levels to watch. A weekly close above $1.80 would be the first sign that XRP is reclaiming short-term structure, aligning with the yellow moving average. A sustained break above $2.20 would mark a full breakout and signal the start of an expansion phase.
A break and hold above $2.20 would shift the market into expansion mode — that's the level that matters for confirming a full structural recovery.
If price fails to hold and reclaim $1.80, the downside scenario puts the $1.15 zone back in play. That level sits at the lower bound of the support range highlighted on the chart and represents the area where buyers would need to step in more aggressively.
The pattern of narrowing ranges resolving into sharp directional moves is well-documented in XRP Price Analysis: Breakout Signals Move Toward $1.60, which covered a similar structural shift following moving average alignment.
Key Levels to Watch:
- Support: $1.30-$1.40 (long-term ascending trendline).
- Short-term resistance: $1.80 (structural ceiling, yellow MA).
- Breakout target: $2.20 (expansion trigger).
- Downside risk: $1.15 (lower support zone)
XRP Price Structure Shows Higher Lows, But Resistance Still Holds
The broader picture right now is one of equilibrium. Higher lows remain intact, which keeps the long-term uptrend structure alive. At the same time, resistance continues to cap every rally attempt, and volatility is compressing to a point where a breakout or breakdown feels close.
Higher lows are intact, resistance is holding, and volatility is compressing. The chart doesn't confirm direction yet, but it clearly shows a market approaching resolution.
Neither buyers nor sellers have fully taken control, but that balance won't hold indefinitely. The structure is tightening toward a resolution, and how price responds to $1.80 and $2.20 in the coming weeks will be the deciding factor.
A comparable tightening setup with similar dynamics is covered in XRP Price Analysis: Ripple Range Tightens After 7 Weeks, Volatility Incoming.
 Peter Smith