 Artem Voloskovets

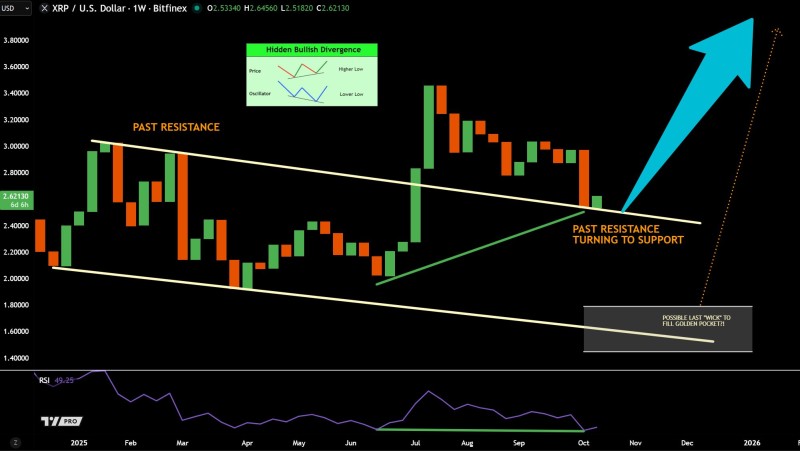
After months of price consolidation, XRP might be setting up for its next move higher. The chart is displaying what technical analysts call a hidden bullish divergence—a pattern that often shows up before strong rallies begin.
Technical Setup: Resistance Flips to Support
Trader JD pointed out this setup, suggesting XRP could be gearing up for a breakout if the current support level holds firm. Looking at the weekly chart, XRP has pushed above a descending resistance line that had been capping gains for months. Now it's coming back to test that same line as support—a classic "flip" that traders like to see. Meanwhile, the RSI indicator is making a lower low even as price makes a higher low, which confirms the hidden bullish divergence. This mismatch between price and momentum often hints at underlying strength building beneath the surface, even during periods of sideways movement.
Possible Retest of the Golden Pocket
There's still a chance XRP dips one more time before any serious rally kicks in. The chart shows a potential wick down into what's called the golden pocket—a Fibonacci retracement zone that sits lower than current prices. If this happens, it would likely shake out traders with weak positions before the next leg up begins. Buyers stepping in to defend that zone could be the fuel needed to push prices higher with more conviction.
Key Levels to Watch
- Support: $2.50–$2.60 (former resistance now acting as support)
- Golden Pocket: Potential dip to $2.20–$2.30
- Upside Target: Breakout toward $3.20+ if bullish divergence plays out
While the chart looks promising, XRP doesn't trade in a vacuum. Broader crypto market liquidity, regulatory news around Ripple, and overall risk sentiment will all play a role in what happens next. A solid bounce here could push XRP into what the chart labels the "green box"—a zone of continued upside. But traders should also keep in mind that rallies can be followed by corrections, especially if momentum fades after the initial move.
 Artem Voloskovets


