 Marina Lyubimova

XRP is grabbing attention again after weathering one of its toughest shakeouts in months. The coin crashed hard, liquidating leveraged traders across the board, but has since staged a solid comeback and is now holding near its recovery highs.
Chart Breakdown: Holding Strong Above $2.60
Market analyst 𝐃𝐎𝐌𝐈𝐍𝐔𝐒 XRP Syndicate believes this cleanup has set the stage for a major move higher, throwing out bold targets of $10 this month and even $100 by year-end. While those numbers sound wild, the short-term chart is showing real strength and a clear shift in buyer sentiment.
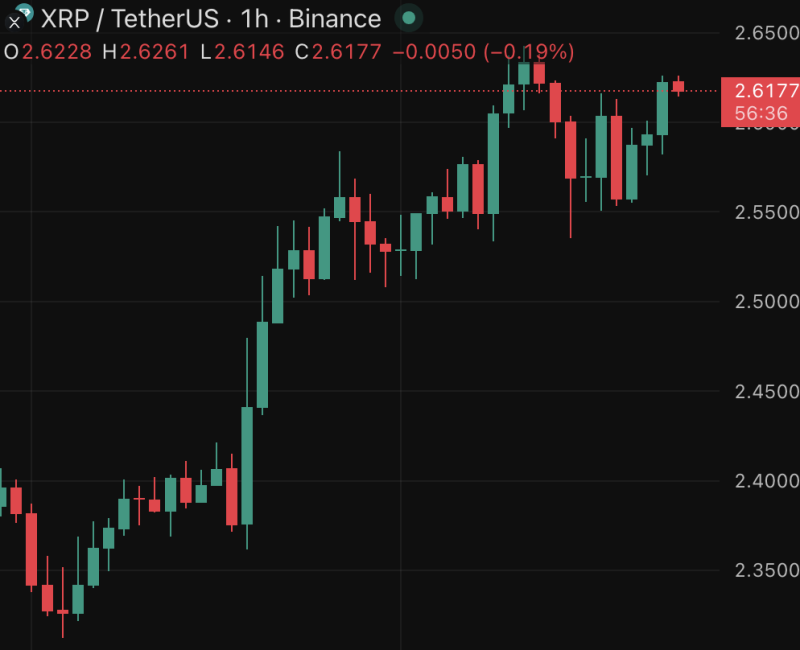
Looking at the 1-hour XRP/USDT chart on Binance, there are some encouraging signs:
- Current Price: XRP is sitting around $2.61–$2.62, staying stable after a sharp climb back up
- Support: The main support zone is between $2.55 and $2.60, with a fallback level around $2.45 if things turn south
- Resistance: Immediate resistance shows up at $2.63–$2.65. Breaking through that could open the door to $2.80 and eventually $3.00
- Trend: The chart's showing higher lows and tightening consolidation, which is usually a good sign that buyers are quietly accumulating
This matches up with what the analyst is saying—after flushing out the weak hands, XRP looks like it's gearing up for something bigger.
What's Driving This?
The liquidation event cleaned out a lot of the overleveraged positions, which often sets up a healthier base for the next leg up. Bitcoin's been moving sideways lately, which has pushed speculative money into major altcoins like XRP. There's also growing retail hype around the idea of $10, even if $100 sounds far-fetched. On the fundamental side, Ripple's improved legal standing and ongoing institutional partnerships continue to support XRP's longer-term story, though right now sentiment and technicals are doing most of the heavy lifting.
If XRP can punch through $2.65 and keep the momentum going, we could see a move toward $3.00–$3.50 fairly quickly. From there, if the speculative fever really kicks in, $10 isn't completely off the table. On the flip side, losing support at $2.55 would likely mean a drop back to $2.40–$2.45, which would slow things down considerably. The $100 target by year-end? That's a stretch by any measure. But the chart does support the case for more upside in the short term.
 Marina Lyubimova


