Usman Salis

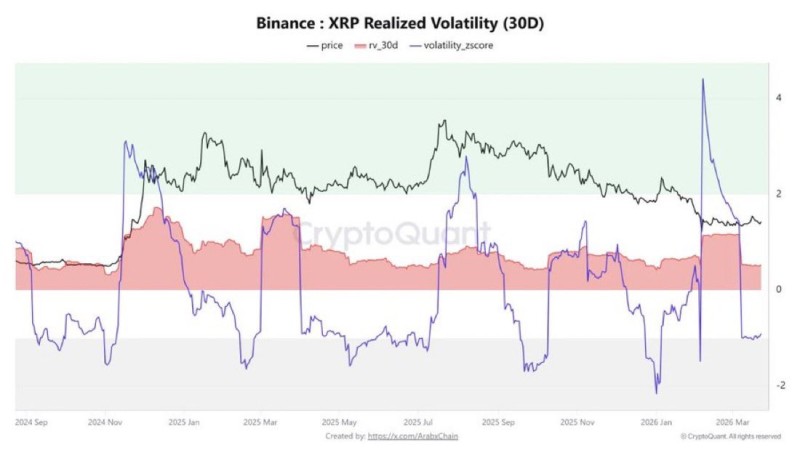
XRP is drawing increased attention after a sharp spike in its 30-day realized volatility, followed by a rapid cooldown, according to recent Binance data. The chart shows volatility reaching extreme levels before falling back toward a neutral range, signaling a notable shift in market conditions. Historically, this type of cycle has been associated with major price movements in the asset.
Volatility Z-Score Drops After Hitting Extreme Territory
The chart highlights how the volatility z-score briefly surged into extreme territory before dropping sharply. This reflects a transition from high-activity conditions, where price moves aggressively, into a compression phase marked by reduced fluctuations. Similar patterns have appeared in XRP markets before, where volatility spikes tend to align with key turning points or periods of strong XRP Price Analysis: Triangle Squeeze Points to Monday Volatility.
Compression Phase Sets Up Potential XRP Breakout
The current compression phase is a key structural element to watch. Historical behavior suggests that when volatility contracts after a spike, it often precedes another expansion phase. This dynamic is reinforced by coverage of how liquidity conditions can drive sharp moves once momentum shifts, as outlined in the analysis of the XRP Price Gap Between $2.51 and $2.73 Could Trigger Volatility.
Broader structural setups point in the same direction. Consolidation phases have repeatedly preceded larger expansions for XRP, a pattern explored in depth in XRP Price Forecast: $27 and $100 Targets in Play as Bullish Wave Structure Holds. With XRP tightening its price structure and volatility compressing, the current setup marks a potential inflection point where the next significant phase of price action may soon begin.
 Usman Salis