 Saad Ullah
XRP (Ripple) chart reveals an interesting setup: a clear liquidity gap between $2.51 and $2.73 where historically few trades took place. These gaps often act like magnets for price action, setting up XRP for potentially sharp moves in either direction.
Chart Analysis: Understanding the Gap Zone
According to Ali, a prominent crypto trader analyzing recent Glassnode data, XRP shows heavy realized volume concentrated in lower price zones around $0.30–$0.70 and again near $2.20–$2.40. However, minimal trading activity appears between $2.51 and $2.73, creating this notable gap where price could move rapidly with little resistance until reaching the upper boundary at $2.73.
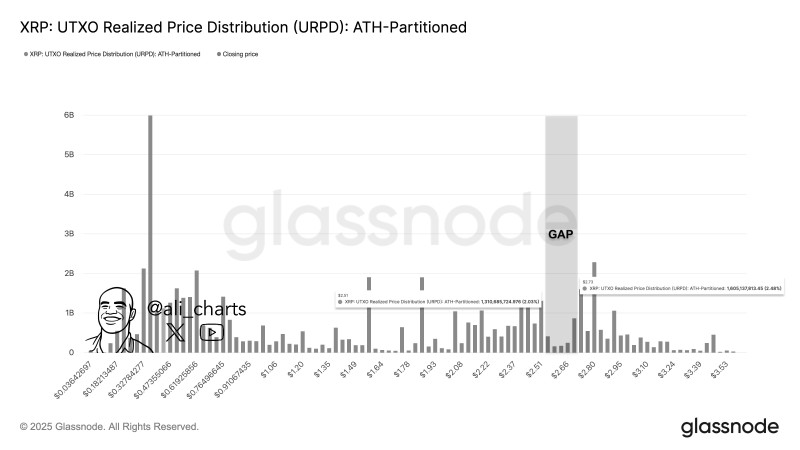
This gap creates both opportunity and risk. For bulls, it represents a potential acceleration zone where momentum could carry XRP quickly higher. For bears, it's a vulnerability where lack of support could lead to swift declines.
Why This Gap Matters
Several key factors could determine whether XRP fills this gap soon. Market sentiment around Ripple's expanding role in cross-border payments continues influencing investor confidence. Broader macro conditions, including U.S. inflation trends and interest rate policies, are shaping crypto market flows. Additionally, XRP historically amplifies Bitcoin's moves during altcoin rallies, meaning any broader crypto momentum could push it toward this critical zone.
These dynamics make XRP's behavior near $2.50 particularly significant to watch.
A Critical Decision Point
If XRP gains momentum above $2.50, traders may quickly push it toward $2.73 to close the gap. However, if buying pressure weakens, this zone could instead become a rejection point that sends price lower.
The key takeaway: this $2.51–$2.73 gap likely won't remain unfilled for long. Investors should prepare for increased volatility as XRP approaches this level, as the lack of trading history in this range could amplify whatever move occurs next.
 Saad Ullah


