 Peter Smith

⬤ Toncoin is trading around $1.59 against USDT while stuck inside a well-defined descending channel on TradingView charts. The pattern has guided price movement for weeks, with TON respecting both upper and lower boundaries of the downward-sloping structure. The key question now is whether the cryptocurrency can finally break free.
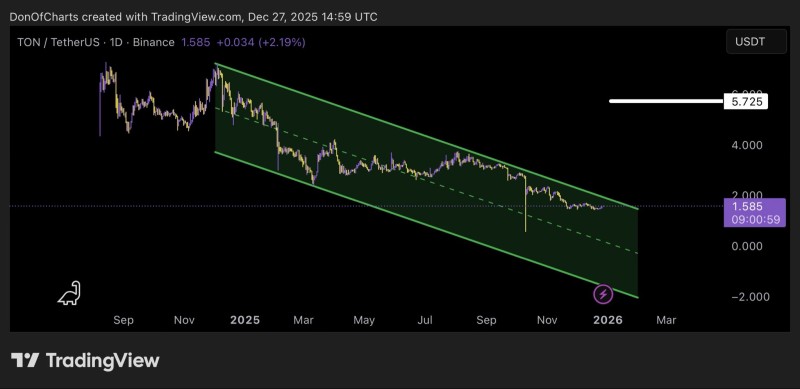
⬤ The chart shows TON moving steadily lower between two parallel trendlines, with a dashed mid-channel line marking the range's center. Recent action has played out near the lower half, reflecting persistent downward pressure. A price label highlights $5.725 as a historical reference point, showing just how far the market has fallen from earlier highs. Current price sits near $1.585 with modest intraday gains.
⬤ The descending channel structure shows Toncoin following a controlled downtrend marked by lower highs and lower lows. While TON has tested the upper boundary at times, each attempt has met resistance so far. The market appears to be consolidating within the channel as traders watch for signs of strength or trend continuation.
⬤ This setup matters because breakouts from long-running channels often signal meaningful shifts in momentum. A sustained move above the upper boundary could indicate improving confidence, while continued trading inside the channel would reinforce the bearish trend. With TON holding near the mid-$1 range, the next decisive move will either confirm continuation or challenge the pattern entirely.
 Peter Smith


