 Alex Dudov

⬤SOL price action is showing early signs of recovery after weeks of downward pressure and sideways drift. The four-hour chart shows the asset moving through a clear downtrend before settling into a consolidation range. As @BitGuru noted, Solana is now pushing off the $80–$83 support zone, a key demand area that buyers have defended consistently in recent sessions.
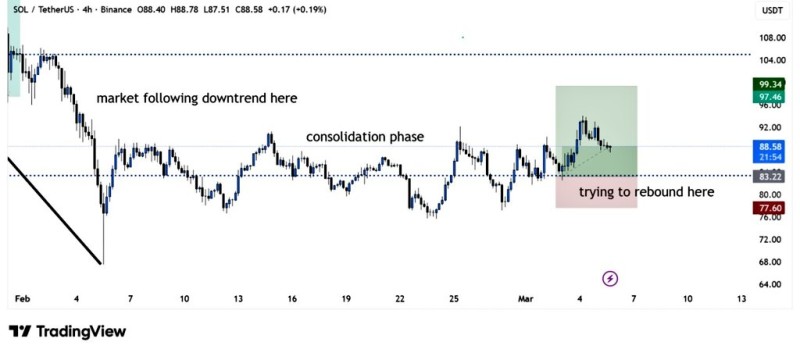
⬤The chart reveals three distinct phases playing out in sequence. First, a sharp decline drove price toward the lower support band. That was followed by a consolidation period, with SOL trading sideways as buyers and sellers found temporary balance. More recently, price started climbing toward the upper boundary of the range, suggesting buyers are quietly building momentum above $80–$83.
⬤SOL is currently trading around $88, right at the upper edge of the recent consolidation range. According to the analysis, the recovery hinges on holding the $80–$83 floor. If momentum continues, the next meaningful resistance sits at $97–$100, a zone that previously capped price during earlier rallies. A clean break above that level would mark a significant shift in short-term market structure.
⬤The current setup is a textbook example of how consolidation phases follow sharp directional moves, allowing new support levels to form before the next leg higher. With SOL rebounding from support and pressing against the top of its range, how price behaves near the $97–$100 resistance zone will likely decide whether this recovery holds or fades back into sideways chop.
 Alex Dudov


