 Alex Dudov
⬤ Solana is making early recovery moves after prolonged selling pressure and sideways trading. SOL is trying to bounce from the $75 support area, and if buyers step in, the market could push toward $90, then $100 and higher levels. The 4-hour chart shows price action hovering around key support and resistance boundaries between roughly $75 and $90.
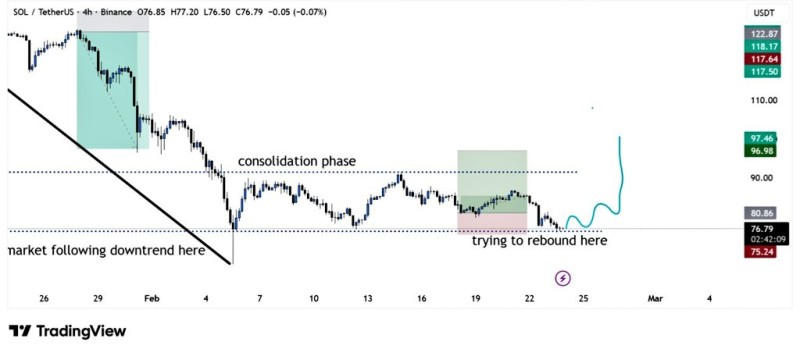
⬤ The chart reveals a clear pattern where SOL followed a downtrend before settling into consolidation. Price recently dropped into the lower range around $76-$77, marked as a "trying to rebound here" zone on the chart, highlighting a critical support region. This setup matches recent coverage noting how SOL tests $76 Support Zone With Eyes on $85-$88 Bounce, where this 4H demand zone has previously sparked short-term rallies. Above current levels, horizontal resistance lines mark the mid-$80s to $90 area, an important barrier as price attempts to break its corrective pattern.
⬤ Technical analysis shows Solana compressing within the $76-$90 range, with buyers and sellers battling inside this band. Market observers point to two near-term scenarios: an immediate bounce from support or a deeper test before momentum builds. Either way, the chart suggests a bullish resolution if price holds the lower boundary and climbs above the consolidation structure. As discussed in Solana Holds $75 Support, Eyes Rebound After Downtrend, mid-range resistance near $90 aligns with previous swing highs, meaning reclaiming this zone would confirm a recovery move.
⬤ How SOL behaves around current support and resistance levels matters for interpreting whether the correction is shifting toward sustained recovery. Holding the $75 support and advancing toward the mid-$80s to $90 area would signal fading bearish pressure and potentially draw renewed interest. Meanwhile, SOL Trades in $76-$90 Range as Breakout Toward $100 Draws Closer notes that failure to stabilize could extend range-bound trading, making this technical battleground crucial for shaping what comes next.
 Alex Dudov


