Sergey Diakov

⬤ Solana remains range-bound with muted upside momentum as price action continues to react to nearby support and resistance zones. The 30-minute SOL/USD chart shows the market holding above its most recent swing support while repeatedly failing to push through overhead supply. The Tuesday low must hold to keep the current micro structure intact, while a move above $92.10 is needed to confirm a breakout to the upside.
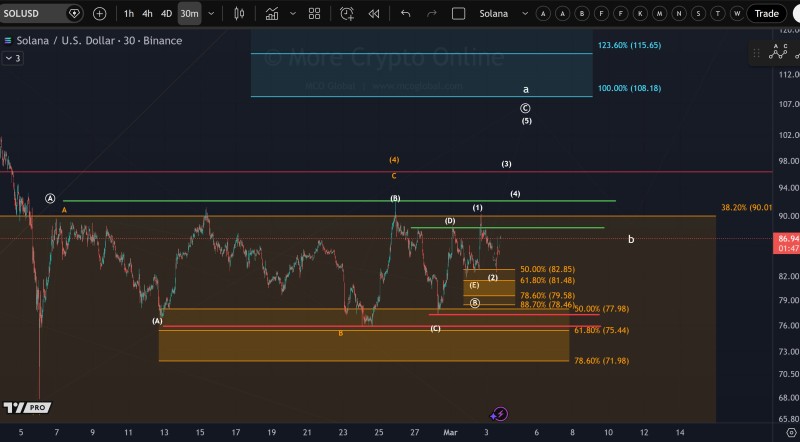
⬤ A resistance band around the $90 area keeps price pinned below, with Fibonacci levels framing the active range. The 38.2% retracement sits near $90.01, while deeper levels fall at $82.85 (50%) and $81.48 (61.8%). Solana testing the $90 resistance zone before a possible breakout has been a recurring theme, reinforcing the view that upside momentum stays weak until $92.10 is cleared.
⬤ If the Tuesday low breaks, the Fibonacci map points to downside reference levels at $79.58 (78.6%), $78.46 (88.7%), and further marks around $77.98, $75.44, and $71.98. Analysts tracking SOL attempting to exit a downtrend after holding major support have highlighted how these lower zones could come into play quickly if buyers lose control of the current floor.
⬤ The $92.10 threshold is the decisive level for near-term market direction. A confirmed break above it would signal buyers regaining control after a choppy consolidation phase. Coverage of key Solana resistance levels shaping the next potential rally points to $96 and $100 as the next targets once that barrier falls, making the current technical setup a critical inflection point for SOL traders.
 Sergey Diakov