 Usman Salis
⬤ Solana appears to be shifting into a wave (4) correction after its recent dip and bounce on the 1-hour chart. The price action suggests the market is moving through a corrective phase rather than gearing up for another strong push higher. Technical structure shows a rebound from recent lows, fitting the typical pattern of an Elliott Wave correction.
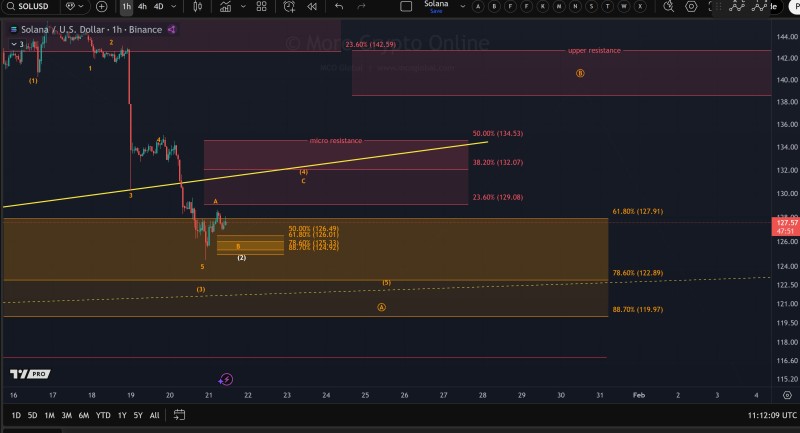
⬤ The 38.2% Fibonacci retracement level around $132 stands out as the main target for this wave (4) pullback. This zone is a classic spot for corrections to land within Elliott Wave setups. While deeper retracements are possible, traders are watching this area closely. A yellow descending trend line on the chart could act as resistance during the upward move, potentially capping gains unless momentum picks up steam.
⬤ Looking at the micro structure, a small five-wave pattern may already be forming wave A within wave (4). Support sits between $124.90 and $126.49—an area that's held up well during recent pullbacks. As long as SOL stays above $124.90 and any dips remain corrective in nature, the odds favor a wave C rally toward that $132 target. This keeps the focus squarely on the mid-$130s while maintaining a cautious stance.
⬤ This setup matters because it helps separate a temporary bounce from the start of a genuine bullish leg. For the outlook to turn more bullish, SOL would need to break through resistance with a clear impulsive move backed by rising momentum. Until that happens, the corrective scenario remains the base case, with price action still needing confirmation before calling for stronger upside.
 Usman Salis


