 Usman Salis
⬤ Solana is approaching a critical technical area that could define its next directional move. The chart points to a potential push toward the $110 retest zone, which previously held as strong support for an extended period before price broke lower. Analysts note that SOL may have "a nice chance" to revisit $110, but the level is considered a major trouble area — prior support often flips into resistance after a breakdown.
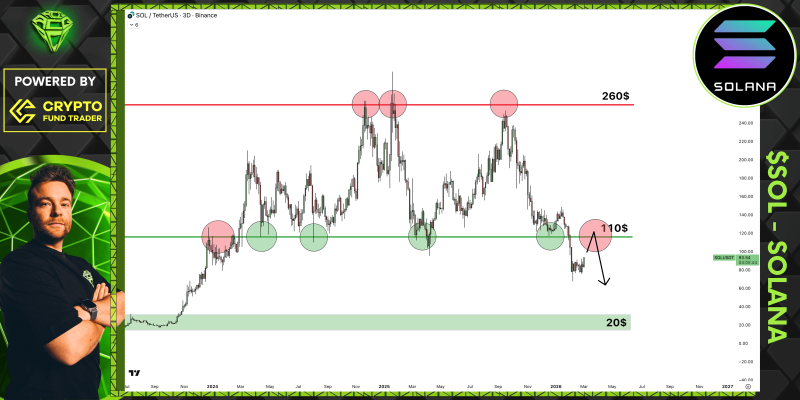
⬤ The chart setup reflects a familiar market pattern: when a long-held support breaks, rebounds tend to stall when price returns to that same area. The $110 region looks positioned as a potential ceiling where sellers may re-emerge. Recent analysis also flagged Solana eyeing the $104-$110 retracement area after a sharp drop, suggesting this band is now the key reaction level as price climbs back.
Prior support can often flip into resistance after a breakdown — $110 is exactly that kind of level for SOL right now.
⬤ The broader chart also highlights major historical zones — resistance near $260 and deep long-term support around $20 — framing the wider technical backdrop. Related coverage tracked Solana rebounding from the $110s and eyeing the next resistance zone, reflecting how the market consistently pivots around this former support during recovery attempts.
⬤ Solana remains a bellwether for broader altcoin sentiment, and reactions around major flipped levels tend to drive short-term volatility across the sector. A rejection at $110 would confirm that former support has turned into resistance. A decisive reclaim, however, would signal a real shift in market control and could open the door to improved sentiment for the next leg of price action.
 Usman Salis


