Usman Salis
Solana is entering a decisive moment on the higher timeframe. According to Don, the next few days are critical - a green monthly close could confirm the end of a six-month downtrend that has defined price action since the $300 peak.
The chart reflects a prolonged corrective structure across multiple monthly candles, with consistent downside pressure shaping overall market behavior throughout this period. The sequence of bearish closes has been steady and clear - no meaningful interruption until now.
Six months of downside pressure, and now the market is finally testing whether it can print a green monthly close - this is the moment that matters.
Why the First Green SOL Monthly Candle Matters
The latest candle is attempting to flip green after months of decline. This is the core signal - not a breakout, but a potential shift in trend behavior at the monthly level. A confirmed green close would represent:
- A break in the sequence of consecutive bearish candles
- The first sign of stabilization after extended downside
- A possible transition away from persistent selling pressure
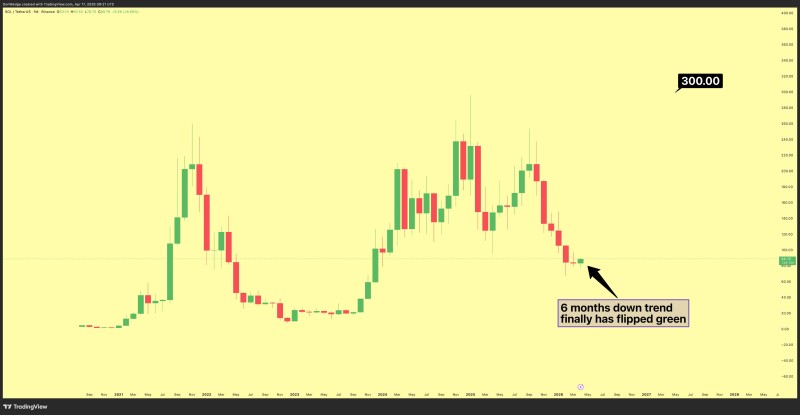
The chart annotation reinforces this reading, pointing directly to the moment where the 6-month downtrend has flipped green. That context is what separates this candle from previous attempts at recovery.
A green monthly close wouldn't guarantee a full reversal - but it would signal a meaningful change in market structure that hasn't been seen in half a year.
Structural Levels That Defined SOL's Path to This Point
Higher timeframe closes carry more weight than short-term price moves. Recent Solana coverage highlights how key levels have repeatedly defined direction. In SOL Price Analysis: Solana Tests Key $146 Range After Rally, price reached resistance and faced a clear decision between continuation and rejection.
Weakness following failed rallies previously pushed price back toward lower support, as detailed in SOL Price Analysis: Solana Slides Toward $119.54 Support Level, where structure remained corrective without any confirmation of a reversal.
Solana has a history of staying trapped within broader ranges until a decisive shift occurs - and the monthly close is the clearest signal of such a shift.
Longer-term context shows how SOL can remain confined within wide ranges for extended periods, as covered in Solana Tests $155 Support for 7th Time in 700-Day Range. That pattern of containment makes the current monthly close all the more significant.
A Critical SOL Close, Not a Confirmed Breakout
At this stage, the chart does not confirm a full trend reversal. The structure remains transitional, and the outcome depends entirely on how the current monthly candle closes. What is clear is that Solana has reached a key inflection point - after six months of downside, it is now testing whether a shift out of the bearish phase is underway, with the monthly close acting as the defining signal.
 Usman Salis