 Saad Ullah
⬤ Solana climbed from the low $120s to test the top of its range near $146, but the rally ran into short-term resistance. After sweeping the range highs, some traders took profits, and the price pulled back slightly. The 4-hour chart shows SOL accelerating from the yearly open before pausing at the upper boundary.
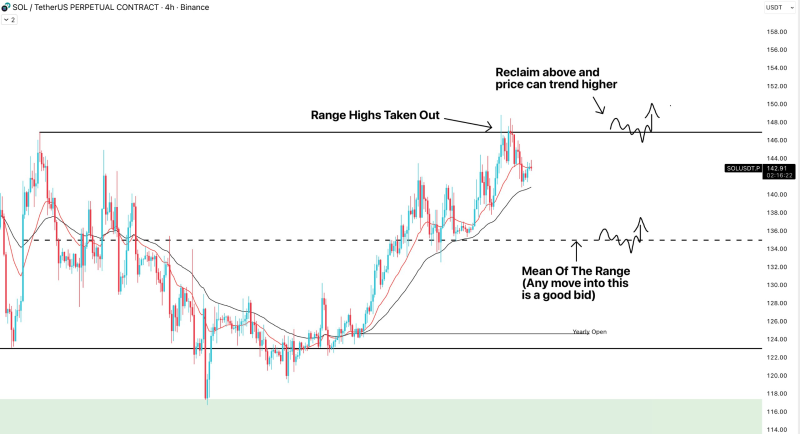
⬤ The key resistance sits around $146–$148, which was briefly broken but hasn't held yet. These liquidity sweeps typically lead to one of two outcomes: either the price breaks through and trends higher, or it rotates back into the range. Right now, Solana is trading below those highs but still holding above important support levels. The uptrend structure remains intact despite the short-term pause.
⬤ Traders are watching the range midpoint near $134 as a potential support zone. If SOL retraces to this level in a controlled way, it could attract fresh buying interest. On the flip side, if the price breaks cleanly above $146 and holds, that would confirm the breakout and open the door for further gains.
⬤ This is a critical moment for Solana's direction. A successful hold above $146 would signal trend continuation, while a pullback to the $134 area would just be healthy consolidation rather than a sign of weakness. Since SOL is still trading above its yearly open and previous breakout levels, how it reacts around these key zones will likely shape the next move and overall market sentiment.
 Saad Ullah


