 Saad Ullah
SOFI's latest move higher comes with an important warning beneath the surface. As Fibby. noted, price rallied from the low $16s into the mid-$19s while flow dropped from slightly positive territory to roughly -$1.5 million - creating a clear bearish divergence between price and conviction capital.
SOFI Price Climbed While Flow Moved the Other Way
The chart shows SOFI price advancing steadily after trading in the low $16 area, eventually reaching the mid-$19s. Over that same stretch, the AlgoFlow line fell sharply, sliding from near positive territory into deeply negative readings. The core message of the setup is straightforward: price pushed to weekly highs while flow sank to weekly lows - that is the main red flag in the analysis.
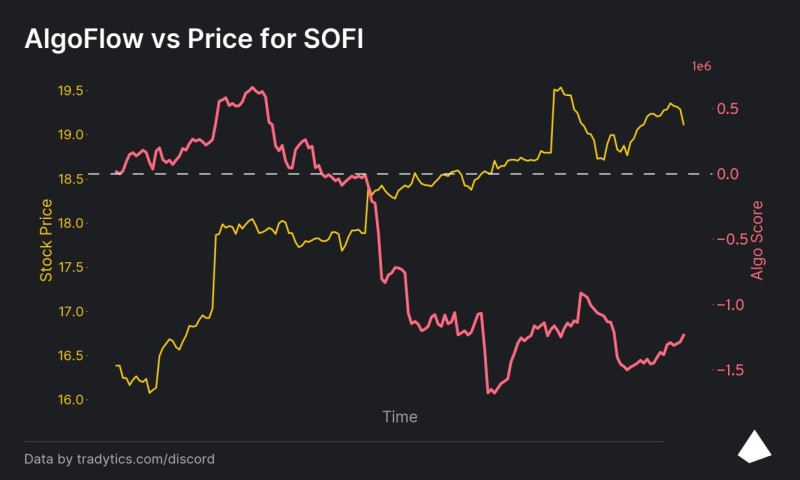
Price pushed to weekly highs while flow sank to weekly lows.
Why the SOFI Divergence Matters Now
This move reads as bearish because the rally happened while 90 DTE money was selling. In other words, longer-duration positioning did not confirm the upside in price. The chart reflects that disagreement clearly: one line trends up, the other trends down. When price rises into strength but flow weakens that sharply, the move can lose support unless underlying demand returns.
The rally happened while 90 DTE money was selling - longer-duration positioning did not confirm the upside.
The SOFI Level That Could Change the Picture
There is one early sign of stabilization. On the right edge of the chart, flow appears to flatten around the -$1.0 million area instead of continuing straight lower. That zone is identified as important: if flow can hold there and start recovering, the mid-$18s could become a floor for a more durable move. Until that happens, the divergence remains the defining feature of the SOFI setup.
If flow holds around -$1.0M and starts recovering, the mid-$18s could become a floor for a more durable move.
What Invalidates the Bearish Read on SOFI
The invalidation condition is explicit. If flow crosses back above zero while price holds the mid-$18s or higher, the bearish divergence weakens materially. Until then, SOFI is still trading with a disagreement between price strength and underlying flow - and that leaves the rally exposed to fading.
Related coverage on TheTradable is also centered on the same stock and nearby structural zones, including SOFI Institutional Zone Shifts to $16-$18 as 125 Million Shares Stack Up, SOFI Stock Anchored at $16 as Dark Pool Battle Over 116 Million Shares Intensifies, and SOFI Stock Trapped Between $16 and $17 as Institutions Stack 161 Million Shares.
 Saad Ullah


