Usman Salis

Solana's price action is showing clear weakness, with the asset turning lower after failing near the top of its range. As Sjuul | AltCryptoGems noted, the chart already pointed to a likely expansion lower - and current price behavior confirms that scenario.
SOL Rejection Near $92 Reinforces the Ceiling
The chart shows SOL trading within a defined horizontal range, with resistance near $92 and support around $68. Price recently pushed into the upper boundary but failed to break through, forming a clear rejection before reversing.
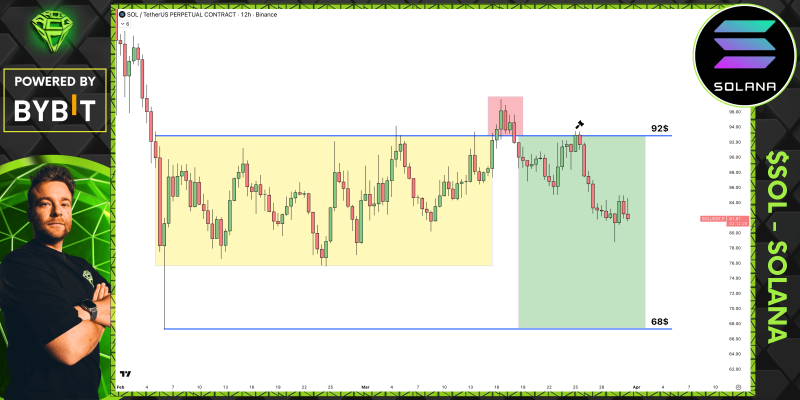
Resistance zones in the $90-$95 region have repeatedly capped upside attempts, and the latest rejection near the highs signals that buyers were unable to sustain momentum.
This leaves the level intact as a firm ceiling. Traders watching SOL price tests $80 as breakdown risk builds will recognize this pattern - repeated failure at the upper boundary tends to accelerate the move in the opposite direction.
From Sideways Structure to Directional SOL Move
Following the rejection, price rotates lower and begins moving away from the upper boundary. This marks a transition from range-bound behavior into directional movement. The structure now reflects a typical range rejection pattern:
- Failure at resistance
- Return inside the range
- Continued movement toward the lower boundary
When a range compresses long enough and buyers can't break the ceiling, the eventual move lower tends to be controlled rather than sudden - which is exactly what the current structure suggests.
Recent setups where Solana tested the $78 support vs $95 resistance battle showed similar dynamics, with SOL compressing before resolving directionally and favoring the prevailing trend.
Lower Range Draws SOL Price Back Toward $68 Support
With price now trading in the lower half of the range, focus shifts toward the $68 support zone. The chart suggests the move lower is not a sudden spike but a controlled continuation, consistent with a bearish structure.
Repeated failure to reclaim resistance tends to keep pressure on support zones - especially when no higher highs are formed.
Broader Solana price action confirms this tendency. Those tracking SOL signals rebound after TD Sequential buy setup are watching whether the $68 level can hold, or whether the absence of a higher high marks the beginning of a deeper leg down.
At this stage, the structure remains intact: resistance holds at $92, and price trends lower within the established boundaries toward the $68 floor.
 Usman Salis