Peter Smith

Shiba Inu is tightening into a critical technical structure, with price consolidating just below a descending trendline and a clearly defined horizontal resistance zone. As World Of Charts pointed out, the current structure is building toward a breakout scenario, with both trendline and horizontal resistance acting as the final barrier. The setup reflects growing pressure beneath resistance, where a breakout could trigger an accelerated move higher.
A Downtrend That Is Losing Structure
The chart shows SHIB in a prolonged downtrend marked by consistent lower highs since late summer. A descending trendline has capped every recovery attempt, reinforcing bearish control over the broader structure.
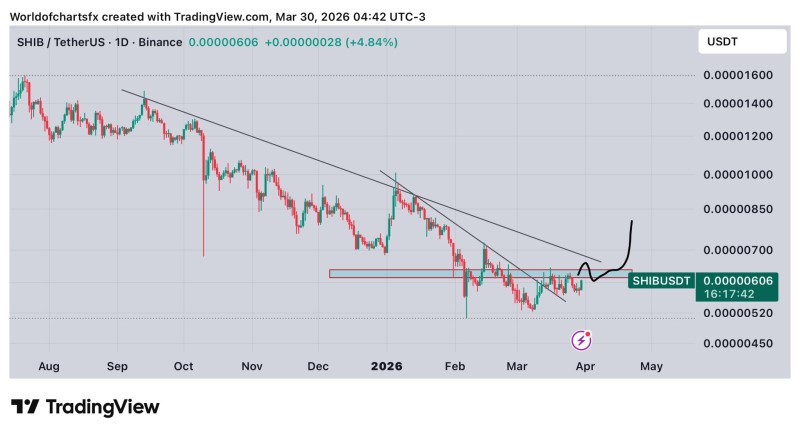
However, recent price behavior signals a shift. Instead of continuing lower, SHIB has stabilized and formed a base around the 0.0000052 - 0.0000060 region. This transition from directional selling into sideways movement suggests that downside momentum is fading.
SHIB Compression Against Resistance Is Building Energy
Price action is now compressed between descending resistance and a flat supply zone, creating a tightening range. This type of structure typically reflects equilibrium between buyers and sellers, where volatility contracts ahead of expansion.
The horizontal resistance zone around current price has already rejected multiple attempts to move higher. At the same time, the trendline continues to push price downward, forcing candles into a narrowing space.
This dynamic closely resembles recent setups described in Shiba Inu tightening near $0.0000060 support as breakout pressure builds, where compression was identified as a precursor to a directional move.
The SHIB Break That Could Change Structure
For the structure to shift, SHIB must break above both the descending trendline and the horizontal resistance zone. That dual breakout would invalidate the pattern of lower highs and open the door to a trend transition.
The chart projection suggests that once resistance is cleared, price could expand rapidly, with limited immediate barriers overhead. Similar scenarios have been observed in Shiba Inu tests $0.0000060 resistance as breakout scenario builds, where a breakout could trigger a sharp upward move.
The current setup can be summarized as:
- Descending trendline acting as dynamic resistance
- Horizontal resistance zone near current price
- Base formation around 0.0000052 - 0.0000060
- Compression indicating potential volatility expansion
A Setup Waiting for Confirmation
Despite the bullish implications, the breakout has not yet occurred. Until price closes above resistance, the broader trend technically remains intact.
This stage - where price compresses just below resistance - is often the most uncertain. It represents potential, not confirmation. As seen in Shiba Inu holds falling wedge support with 36% breakout potential, holding support while pressure builds can precede a breakout, but failure at resistance can extend consolidation.
Holding support while pressure builds can precede a breakout, but failure at resistance can extend consolidation.
For now, SHIB sits at a clear decision point. The structure is no longer trending cleanly downward, but it has not yet transitioned into an uptrend. The next move will likely define direction - and if resistance breaks, momentum could shift quickly.
 Peter Smith