The Recent Price Action of Bitcoin
The price of Bitcoin has been trying to go below $10,000 for several days in a row, but data from the blockchain itself indicates a continuing bullish trend.
The price of Bitcoin decreased in five days from $11,462 to $10,000, which is a 12.6% decrease. Gold has also struggled with the recovering U.S. dollar from the fading momentum.
Bitcoin on-chain Data
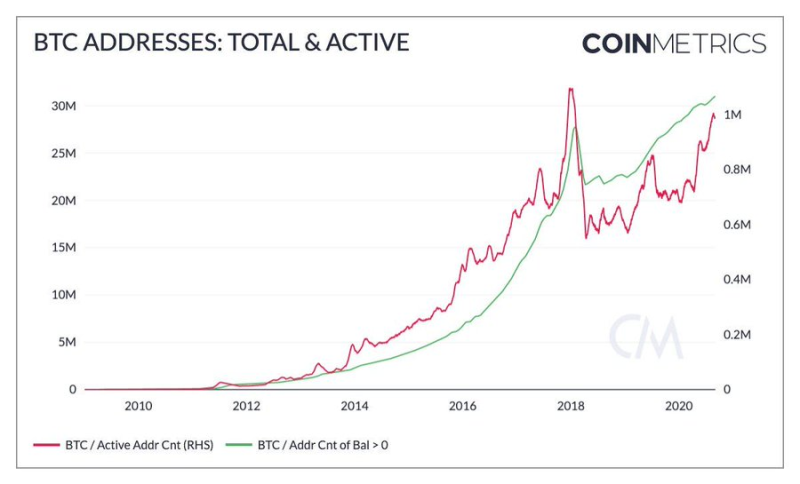
At the same time, activity in the Bitcoin network does not getting diminished. This means showing interest in cryptocurrency and actively using it. So, the number of active addresses reached to historical peaks, which confirms that the bullish trend has not been weakened.
Bitcoin's active address count (30dma) is approaching all-time highs, whilst total addresses with balance continue to grow, showing no signs of slowing down via @coinmetrics Unfolded @cryptounfolded via Twitter

Data on the chain may indicate that the sharp drop in Bitcoin from $12,000 is taking place within the medium-term trend. Although the price of BTC has fallen by almost 20%, network activity has remained relatively stable since its one-year high.
Fear and Greed Indicator
It is worth to note that the 'social' indicator of the price of Bitcoin is the index of fear and greed. However, it often correlates with data from the network itself.
The steep fall of Bitcoin which broke its $10,000 long-term support line, was even lower terrified investors. The Fear and Greed Index settled at a level of 39, which indicates 'fear". A value of 0 of represents "Extreme Fear" and a value of 100 talks about "Extreme Greed".

 Alex Dudov

 Alex Dudov


