 Artem Voloskovets
⬤ Nvidia's stock is showing some real strength lately on the four-hour chart after bouncing back from recent lows and pushing back above several short-term technical levels. NVDA is being positioned as a potential leader into a Santa rally. The stock's trading around the $188–189 range after climbing back from the mid-$170s and holding above multiple support zones.
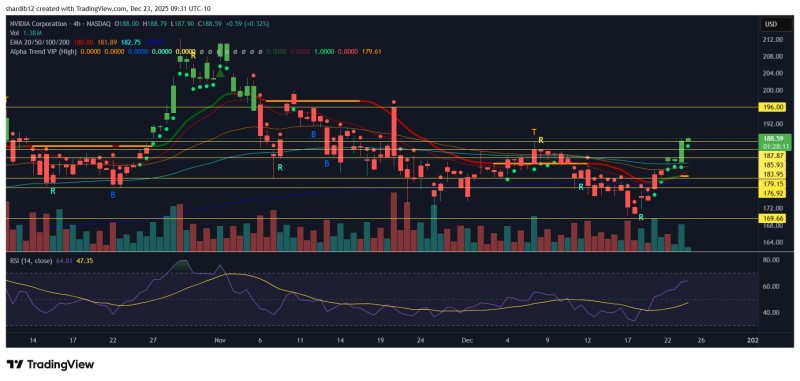
⬤ The chart shows NVDA moving back above a cluster of short- and medium-term exponential moving averages that had been acting as resistance before. Key levels around $176.90, $179.15, $183.95, and $187.87 look like they've flipped into near-term support as the price moved higher. Trading volume picked up during the rebound, which suggests stronger participation as NVDA lifted from its recent base.
⬤ Momentum indicators are looking better too. The relative strength index climbed from below 40 to the mid-60 range, signaling a recovery from oversold conditions without hitting extreme levels. This type of RSI movement usually shows up during early trend recovery rather than exhaustion. Price action also shows a pattern of higher lows following the December pullback, which backs up the idea that downside pressure has eased for now.
⬤ This setup matters for the broader market because Nvidia remains a major player in large-cap tech and semiconductor stocks. When NVDA stabilizes and starts reclaiming technical levels, it tends to influence sentiment across the entire sector. As the year winds down, NVDA's ability to hold above recent support and keep momentum going could help shape the overall market tone during the Santa rally period.
 Artem Voloskovets


