Peter Smith

⬤ Meta Platforms stock is catching eyes after trading patterns revealed strong buying pressure bunched up around the $713 price zone. Large buyers seem to be actively working this area, which has helped steady the price action and keep META trading near the upper part of its recent range. The order flow charts show repeated buy signals and cumulative positive activity near this level, pointing to ongoing interest from bigger market players.
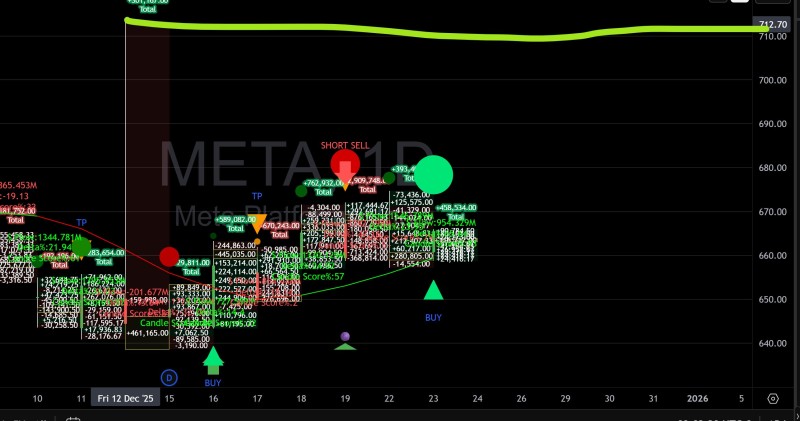
⬤ The data shows META consolidating after an earlier upward push, with the price holding above lower intraday marks while buyers jump in during brief pullbacks. Green markers and positive net totals dominate the chart, signaling steady inflows, though scattered short-sell markers show that selling pressure hasn't disappeared entirely—it's just being contained. Despite these occasional selling attempts, the price hasn't broken cleanly below the key support zone.
⬤ What's happening around the $713 mark looks technically important because the repeated defense of this level is turning it into a near-term reference point that traders are watching. The chart suggests demand keeps absorbing whatever selling shows up, locking the price into a tight consolidation band.
⬤ This matters for the broader market because Meta is a heavyweight in major tech indices, and its price stability can ripple through overall market sentiment. When buying pressure holds firm at a clear level, it tends to smooth out short-term volatility and prop up broader index performance. But if META fails to defend this zone, momentum could shift quickly. As the stock continues hovering around $713, the tug-of-war between buyers and sellers will be a key signal for where things head next.
 Peter Smith