Saad Ullah

⬤ Advanced Micro Devices shares have shifted into correction mode after a strong run that topped out near $260. Market focus is now turning to potential buying opportunities below $200, especially around the 200-day moving average. The daily chart shows AMD backing away from recent peaks while still holding within its broader upward trend pattern.
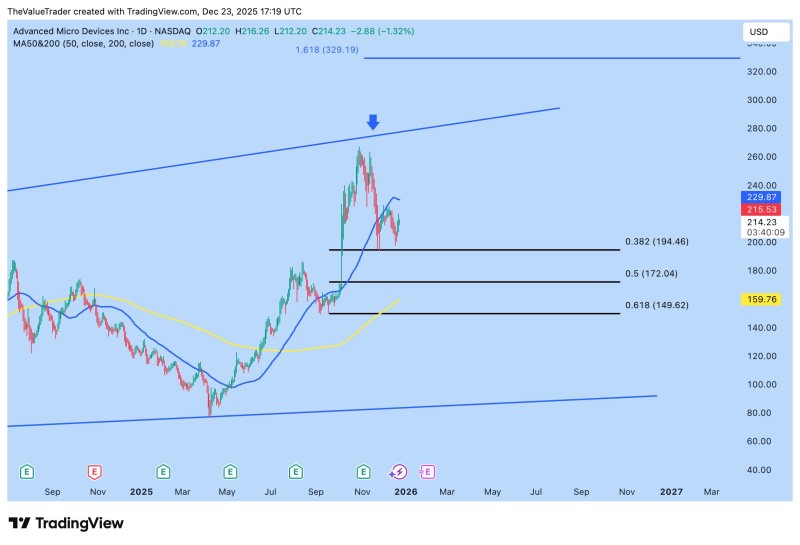
⬤ The technical setup reveals several important Fibonacci retracement zones that frame where price might find support. The 0.382 retracement sits near $194, the 0.5 level is around $172, and the deeper 0.618 retracement lands near $150. Right now, AMD is trading around $214—below its short-term bounce highs and in the pullback zone. The 200-day moving average is positioned close to $200, matching up with the key area traders are monitoring.
⬤ From a technical standpoint, the bigger picture still looks healthy despite recent weakness. The chart shows AMD climbing within a long-term upward channel before hitting resistance near the upper boundary. The pullback that followed appears controlled rather than chaotic, pointing more toward consolidation than a breakdown. Price is still comfortably above the lower trendline, and the 200-day moving average stands out as a critical checkpoint for judging trend strength.
⬤ This matters because AMD is a heavily watched semiconductor stock that often reflects broader sentiment around chips, data centers, and tech demand. How the stock behaves near $200 could set the tone for short-term momentum across the entire sector. A measured pullback toward long-term support would keep the uptrend alive, while failure to hold these levels might signal a deeper correction is underway. As AMD trades in this technically loaded zone, market watchers are zeroed in on whether support near the 200-day moving average can hold firm.
 Saad Ullah