 Usman Salis

⬤ The monthly LTC/BTC chart is setting up for what could be a significant shift. Right now, Litecoin's ratio against Bitcoin is hovering around 0.000827, creeping toward the 50-period weekly moving average and butting up against a long-term downtrend line that's been holding it down. That the Relative Strength Index is breaking upward from compressed levels while showing positive divergence - a sign that selling pressure might finally be easing. This convergence of technical factors suggests the persistent weakness in LTC/BTC's multi-year downtrend could be losing steam.
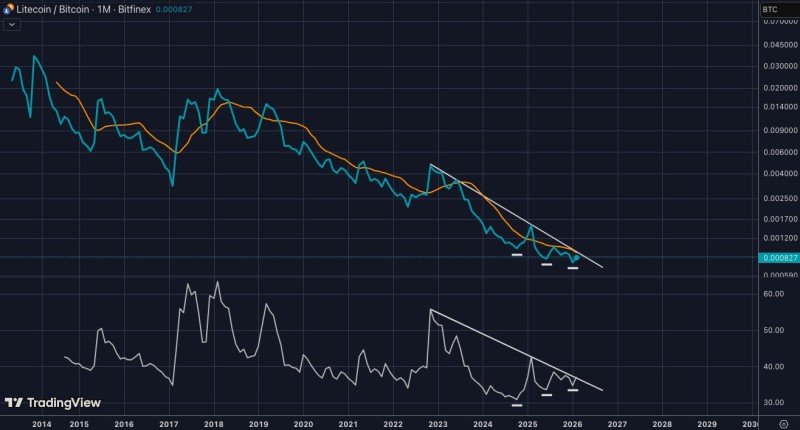
⬤ For years, Litecoin has been grinding lower against Bitcoin, printing lower highs and respecting that stubborn descending trendline. The RSI mirrored this weakness for a long time, but recently it's been making higher lows even as price stayed flat - classic positive divergence. If LTC/BTC can actually punch through the confluence of the 50 WMA and that downtrend line, it would mark a real structural shift. These kinds of breakouts don't happen in isolation - they typically signal broader changes in how traders view relative strength between assets.
⬤ Litecoin remains one of crypto's old guards, and how it performs against Bitcoin acts as a temperature check for altcoin sentiment overall. The current setup matters because when established altcoins start gaining ground on BTC, it often means capital is rotating beyond just the flagship cryptocurrency. Litecoin's real-time price action continues to move in tandem with Bitcoin's swings, but the technical divergence suggests this correlation might be ready to shift.
⬤ Whether this ratio actually breaks out or gets rejected again at these resistance levels will tell us a lot about where the broader crypto market is headed. A sustained move higher for LTC/BTC would signal that alternative digital assets are regaining strength relative to Bitcoin's dominance - potentially opening the door for wider participation across the cryptocurrency landscape. For now, all eyes are on that confluence zone where the 50-week moving average meets the downtrend line.
 Usman Salis


