 Saad Ullah

⬤ Litecoin has been bleeding value against Bitcoin for years now. The LTC/BTC chart shows a sustained downtrend with price continuing to respect a declining resistance line that's been in place for multiple years. Below the price action, the long-term RSI follows a similar downward-sloping structure, reflecting the same prolonged weakness.
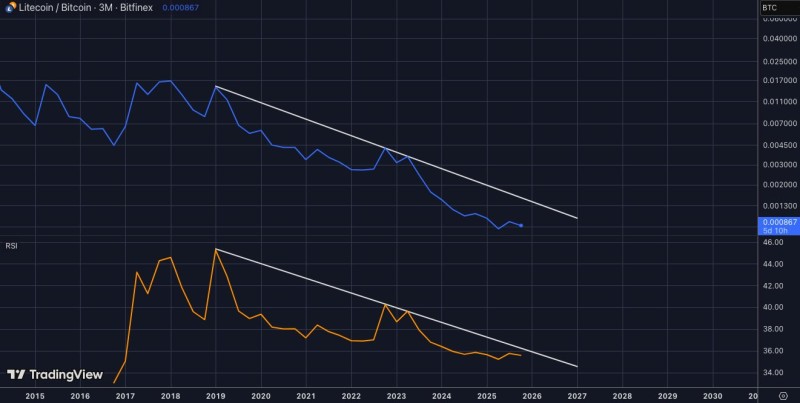
⬤ The LTC/BTC ratio sits close to historical lows, highlighting just how much Litecoin has underperformed compared to Bitcoin. While the dominant trend remains negative, there have been brief stabilization periods and short-lived bounces along the way. The RSI stays suppressed but has lifted slightly from its cycle lows, matching the modest stabilization visible in price.
⬤ Litecoin's multi-year underperformance versus Bitcoin tells a bigger story about how capital flows within crypto. Once considered a foundational altcoin, LTC's struggle against BTC shows how preferences evolve in digital assets. Whether Litecoin can finally break above its long-standing downward resistance may signal broader sentiment toward legacy altcoins going forward.
 Saad Ullah


