 Artem Voloskovets
⬤ Litecoin is sitting right at the bottom edge of a massive symmetrical triangle that's been building on the weekly chart for years now. Price is testing the lower trendline around the mid-$70s, an area that's held up as support before. The compression is getting tighter, and LTC is still holding inside the pattern without breaking down.
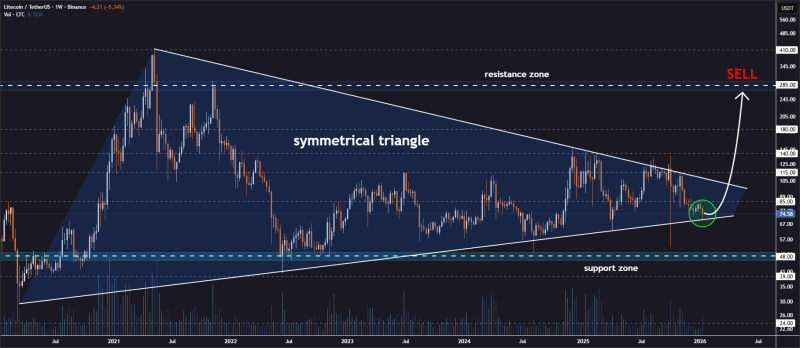
⬤ This triangle has been forming since the 2021 top, with a descending resistance line above and a rising support line below. Right now, price is hugging that lower boundary near $70, where buyers have stepped in historically. There's no confirmed breakdown yet—just price hanging out near support while the squeeze continues.
⬤ If LTC bounces from here, there are several resistance zones to watch. First stop would be around $85, then higher levels near $115 and $140 that line up with previous consolidation areas inside the triangle. Beyond that, longer-term targets sit around $180 and $285, matching earlier cycle highs.
⬤ Symmetrical triangles usually lead to bigger moves after long periods of compression. How Litecoin reacts at this lower boundary could signal whether it's going to keep consolidating or finally break into a more volatile phase. Since LTC often moves in sync with other altcoins, this setup could give hints about where the broader market is headed next.
 Artem Voloskovets


