Peter Smith

A long-term technical signal is forming on Litecoin's chart, drawing attention to a potential bearish crossover between major moving averages. Crypto analyst Surf pointed out that the 50-week moving average is about to cross below the 100-week moving average - a setup often interpreted as bearish. However, the chart emphasizes a more nuanced view: this signal may reflect a pause within a broader cycle rather than a clear sell trigger.
Litecoin's Bearish Cross Arrives Late in the Downtrend
The chart shows Litecoin trading around the $50 zone after a prolonged decline from prior cycle highs. The 50-week moving average is now curling lower and approaching a cross beneath the 100-week average.
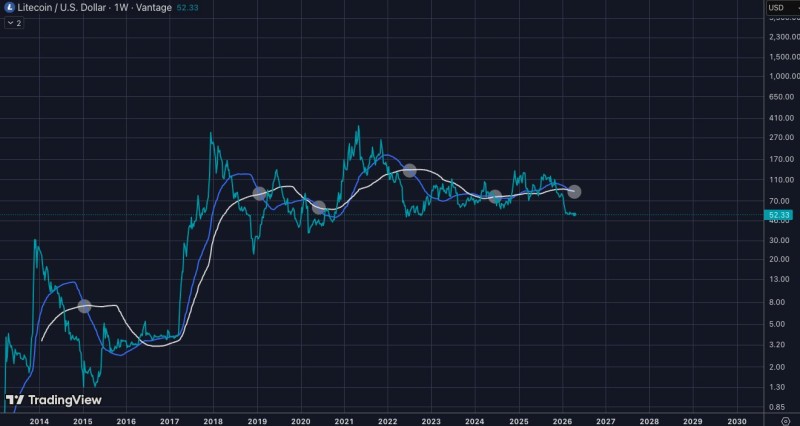
Importantly, this crossover is happening after the majority of the downtrend has already played out. That timing aligns with the idea that such signals do not necessarily mark the beginning of weakness - they often appear late in the cycle. Instead of accelerating downward, price action has stabilized, with volatility compressing and directional momentum fading.
The crossover reflects cooling momentum, not the start of fresh selling pressure - and timing is everything when reading this kind of signal.
Litecoin Structure Suggests Pullback, Not Breakdown
Zooming out, Litecoin's price action no longer reflects an aggressive bearish trend. The chart shows a market that has transitioned into a sideways structure, with repeated interactions around the moving averages. This behavior supports the view that the market is pulling back, not collapsing, and price remains within a broader range-like structure.
Similar behavior has been observed in past Litecoin setups, where consolidation phases followed sharp declines before the next directional move. Support zones in these cases acted as accumulation phases rather than breakdown points - a pattern worth keeping in mind here.
This type of environment is usually not when you want to sell. The crossover, in context, appears to be part of a broader reset.
Why the 50/100-Week Cross Often Misleads LTC Traders
The key insight is that moving average crosses can be misleading when viewed in isolation. In this case, several factors reduce the bearish weight of the signal:
- The cross is lagging, not leading
- Price is not making new lows
- Long-term structure shows compression rather than expansion
Historically, Litecoin has spent extended periods in range-bound conditions before larger moves develop. The current setup fits that pattern - a period of digestion rather than deterioration.
Litecoin Resets Between Cycles Near $50 Support
Rather than signaling panic, the current setup reflects a market in transition. The strong directional moves of previous cycles have given way to slower, more controlled price action around key levels.
When a bearish cross forms after price has already compressed and support is holding, the signal carries far less weight than it would mid-trend.
The crossover, in context, appears to be part of a broader reset - a phase where the market digests prior moves before defining its next trend. For Litecoin at $50, the message from the chart is the same: this looks more like a market catching its breath than one preparing to fall further.
 Peter Smith